

Project Date: May 2019 - December 2022
My Role: UX research, survey design, heuristic evaluation, interviews, focus groups, observation, secondary research, data analysis, UX/UI design, ideation, affinity mapping, content strategy, research coordination, study recruitment, regulatory (IRB) support, poster preparation/write up, manuscript preparation/write up
Project Team:
Dr. Ehsan Hoque, Principal Investigator
Associate Professor, University of Rochester Department of Computer Science
Co-Lead, Rochester Human-Computer Interaction Group (ROC HCI Group)
Research Pillar Leadership Team, Institute for Human Health and the EnvironmentDr. Ray Dorsey, Co-Principal Investigator
Professor, University of Rochester Center for Health + Technology (CHeT)
David M. Levy Professorship, University of Rochester Department of NeurologyEllie Wagner, UX Researcher & Designer
Senior UX Specialist, University of Rochester Center for Health + Technology (CHeT)Taylor Myers, Research Coordinator
University of Rochester Center for Health + Technology (CHeT)Phil Yang, Research Coordinator
University of Rochester Center for Health + Technology (CHeT)Computer Scientists from the ROC HCI group
Funding: Gordon and Betty Moore Foundation, National Institute of Neurological Disorders and Stroke (NINDS) - Morris K. Udall Centers of Excellence for Parkinson’s Disease Research
Overview
Background
Parkinson’s disease (PD) is the fastest growing brain disease. Over 10 million people live with PD worldwide, and estimates suggest that this number is significantly higher given the fact that many people with PD are either not diagnosed or misdiagnosed. Moreover, those who live in rural or under-served areas face particular challenges relating to PD diagnosis, treatment, and care given the fact that PD experts – neurologists and movement disorder specialists - tend to locate in more urban settings.
A secure, web-based PD self-assessment tool, PARK’s aim is to address these challenges in accessibility to care in support of timelier medical intervention for improved outcomes. The PARK tool is designed to predict the likelihood of a person having PD. In the current iteration, users complete a series of five tasks spanning speech, facial, and motor domains as inspired by Part III of the Movement Disorder Society-Unified Parkinson’s Disease Rating Scale (MDS-UPDRS), which can be delivered remotely (see Schneider et al, 2020).
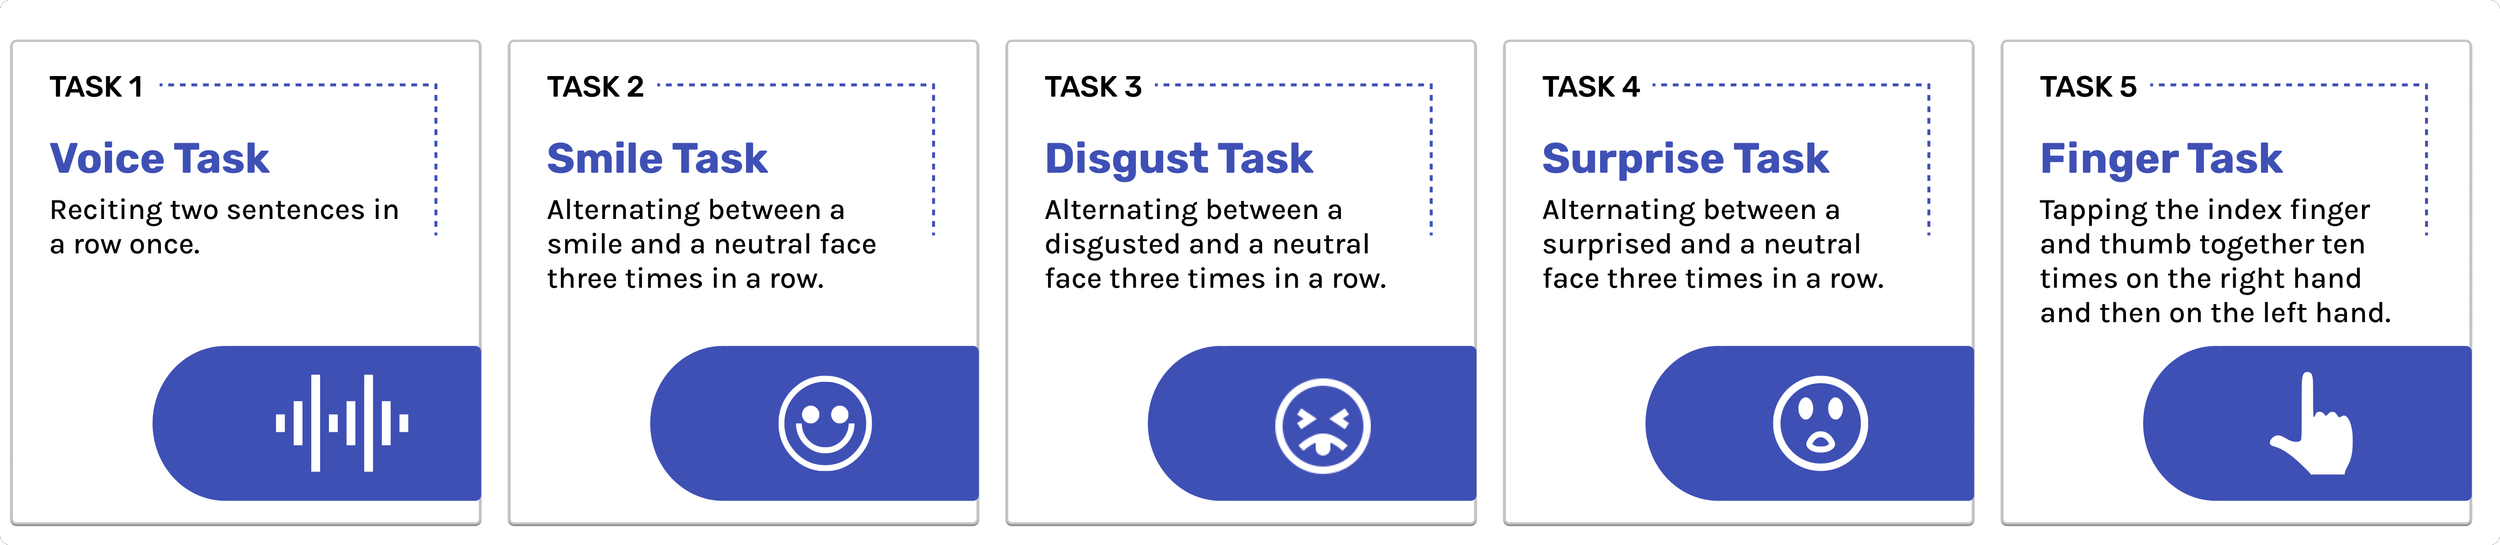
PARK generates task scores for each of the domains based on the audio and video data, which are fed to multiple pre-trained machine learning models. The three scores are then combined to generate a categorical description of PD risk. With computer access - including Internet, webcam, microphone, and Google Chrome - anyone, anywhere can use the PARK tool.
Goals
My UX work with the PARK initiative informed initial improvements to the tool for use in the clinical study and later centered on enhancements to the overall user experience to ensure that a public-facing version of the tool is user-centered - intuitive, accessible, and supportive for all potential users in terms of technology infrastructure, design, and content. These contributions spanned 3 years from 2019 through 2022, including a 1-year hiatus, during which time the study team refined and validated the models based on participant feedback and the UX research and design efforts completed.
Process
2019 Work - Improving PARK UX for Clinical Study Use
In 2019-2020 I evaluated the interface design, content, and overall usability of the PARK tool, which already was in use in a clinical study. While it is preferable to undertake usability testing pre-development, this evaluation served to identify several areas for improvement. The findings were condensed into multiple slide reports and shared with the PARK project team with recommendations later implemented. In addition to UX work over this time period, I supported the operations of the virtual clinical study as needed.
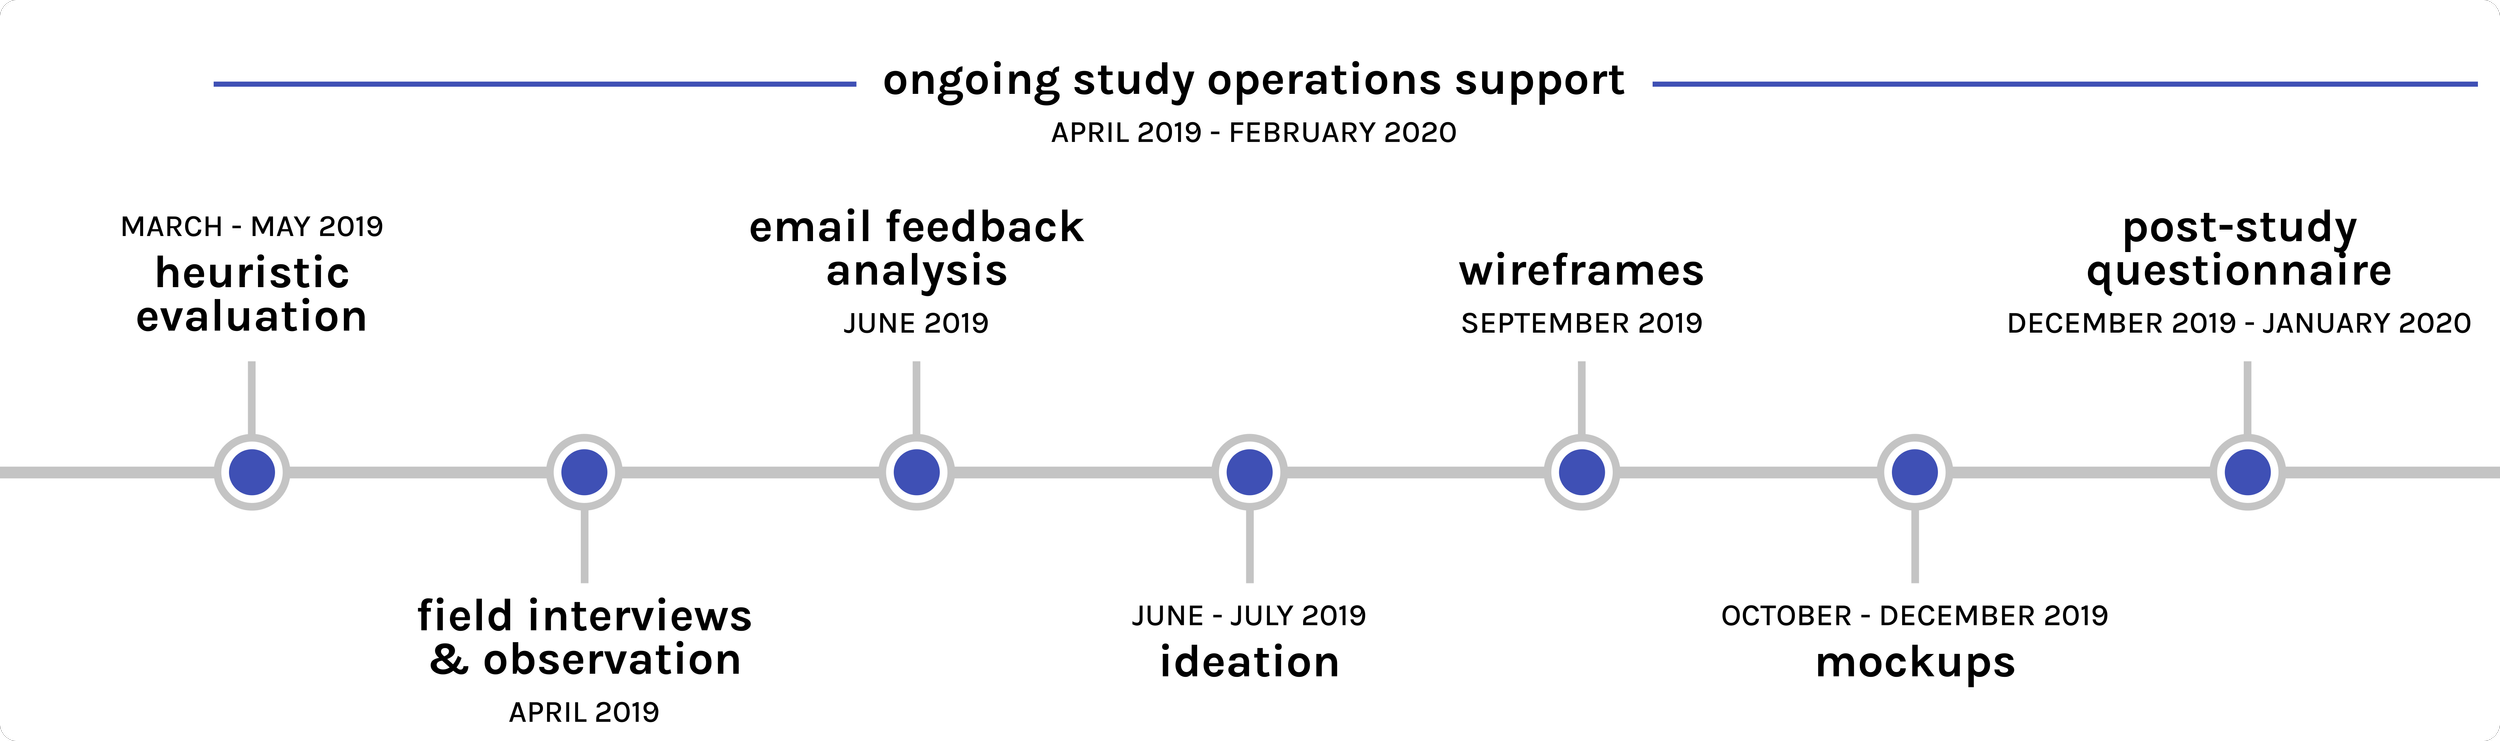
Observations & Field Interviews

To gain additional insights into how well individuals with PD engaged with the then existing PARK iteration, I observed several individuals - who were not involved with the clinical study - as they used the tool. These observations were conducted at Rock Steady Boxing in Rochester, NY, a non-profit which offers non-contact boxing fitness classes for individuals with PD.
After class, two research coordinators and I guided volunteers individually through the use of the tool. They then engaged with the tool unassisted. During this session, I was able to observe interactions and identify user pain points and mistakes. I kept notes on comments made and questions asked by the volunteers. When appropriate, I asked the volunteers a list of questions, which I had developed previously about their experience engaging with the tool.
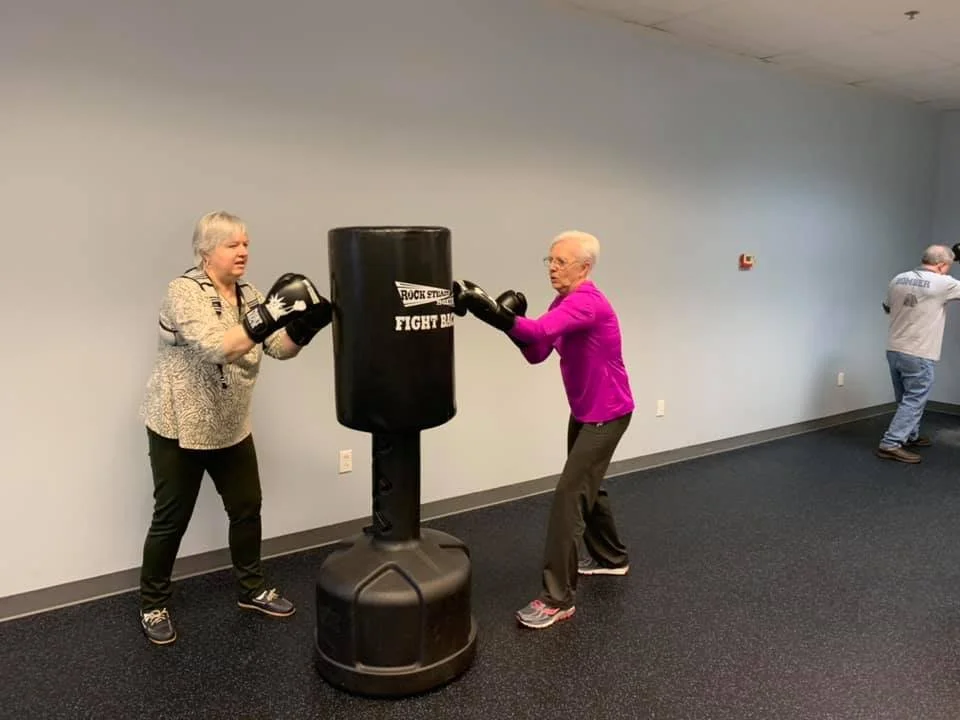
Photo courtesy of Rock Steady Boxing - Victor, NY
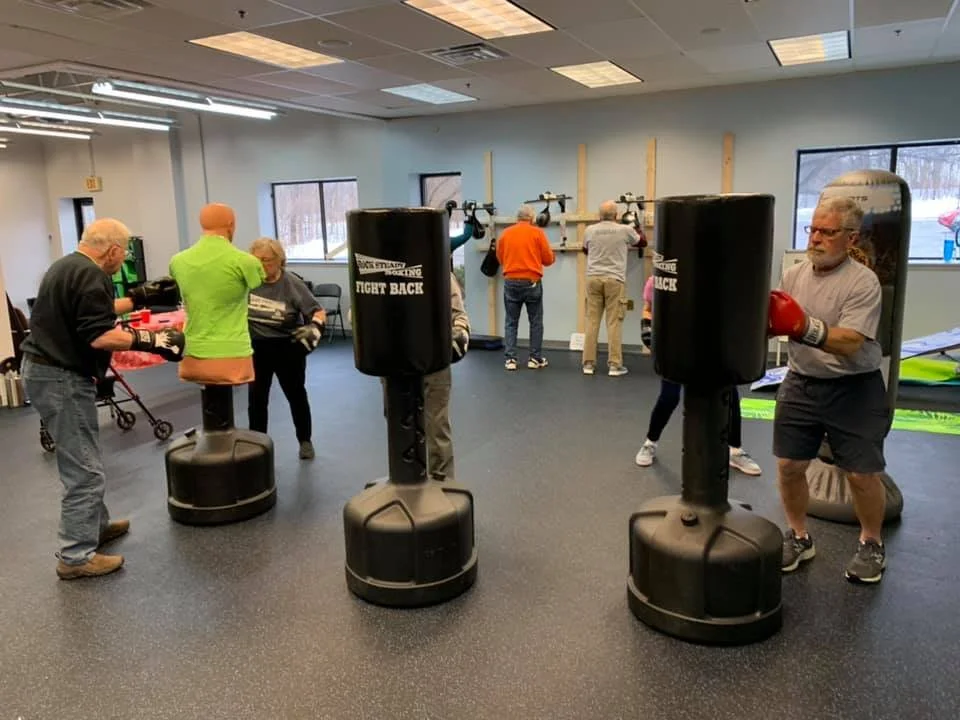
Photo courtesy of Rock Steady Boxing - Victor, NY
Key Takeaways
Heuristic Evaluation
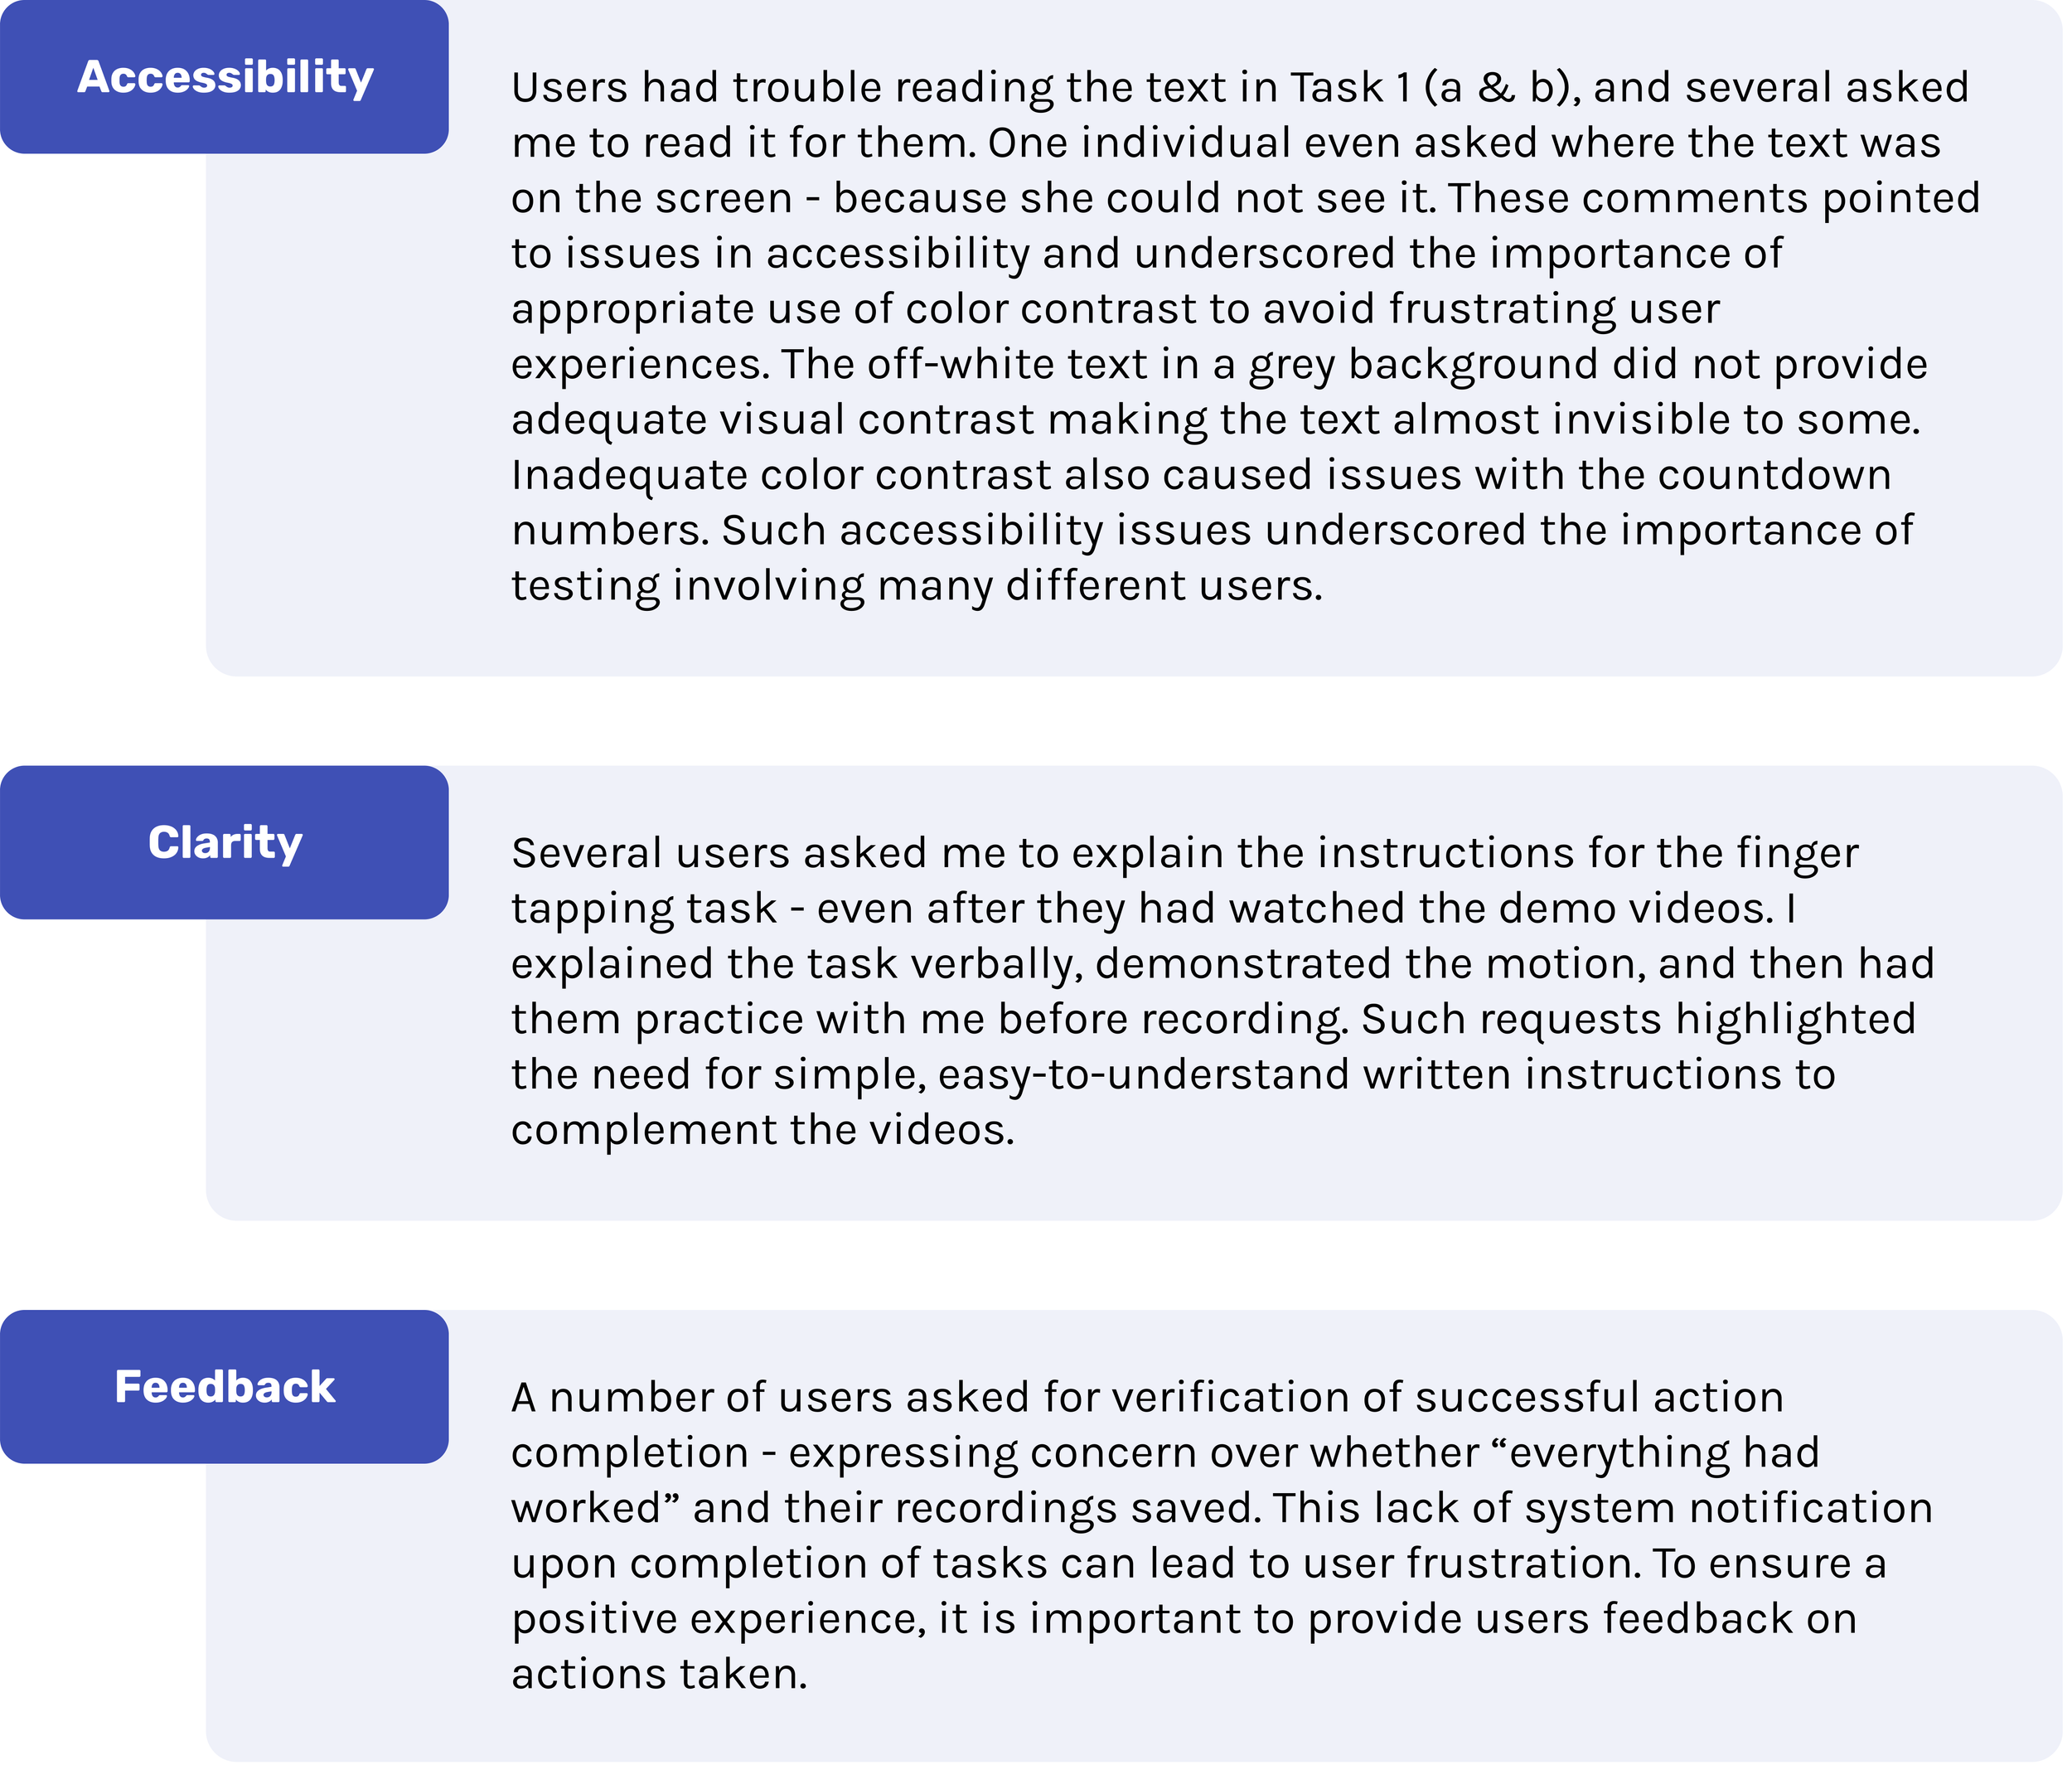
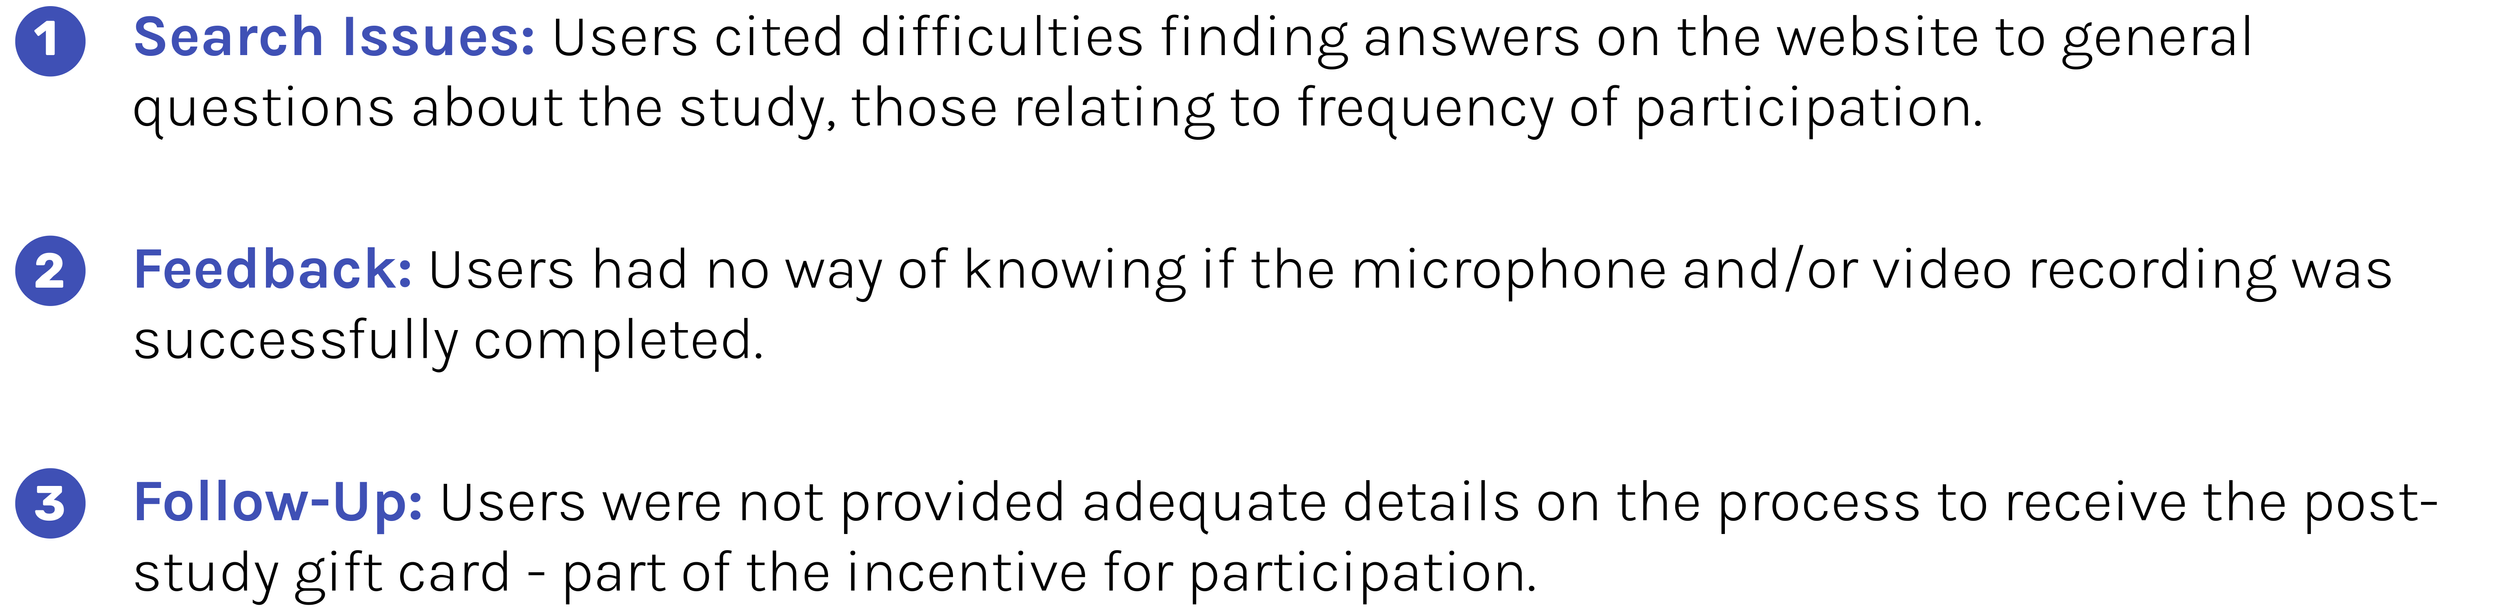
While the PARK tool was functional at the time, the research team noted several critical usability issues during deployment as part of a clinical study. The identified problem areas had a negative impact on the user experience for this disease population. In addition, they had the potential to affect the quality of the data collected. To delve deeper into the extent of the usability and functionality issues, I conducted a heuristic evaluation of the user interface design - applying 11 usability heuristics - modified from Jakob Nielsen’s original 10 principles. In the process, I engaged as much as possible with the tool as a first-time user would.
Key Takeaways
Qualitative Analysis of Email Feedback
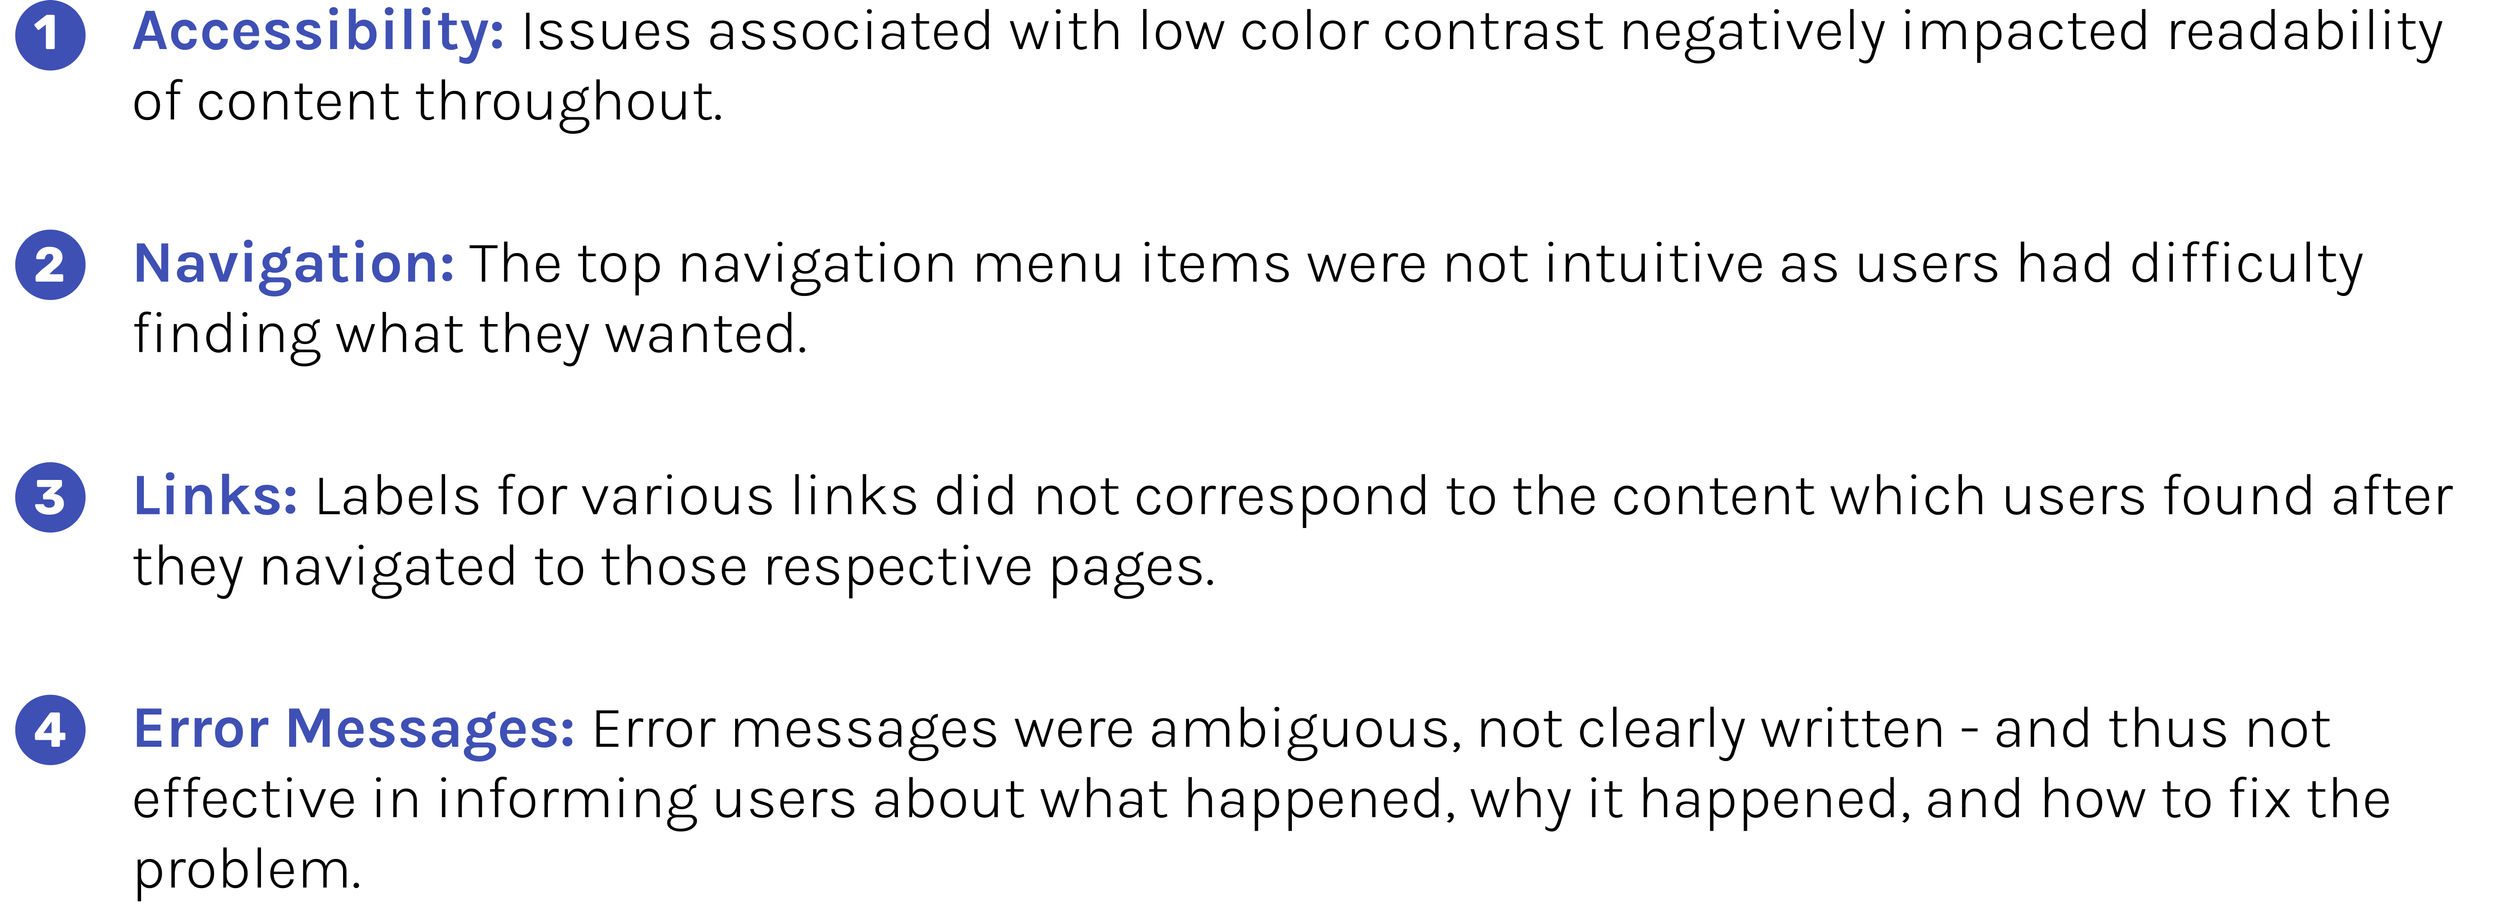
Study participants were provided an opportunity to submit feedback on their experience with the PARK tool via an email address available on the website. Based on this feedback, I created an affinity wall using separate post-it notes for individual user comments. Similar ideas were grouped together, and thematic groups combined to create a hierarchical diagram. While the number of post-it notes used was relatively limited, the process proved valuable in identifying issues with the PARK tool. Below are photos of the affinity wall.


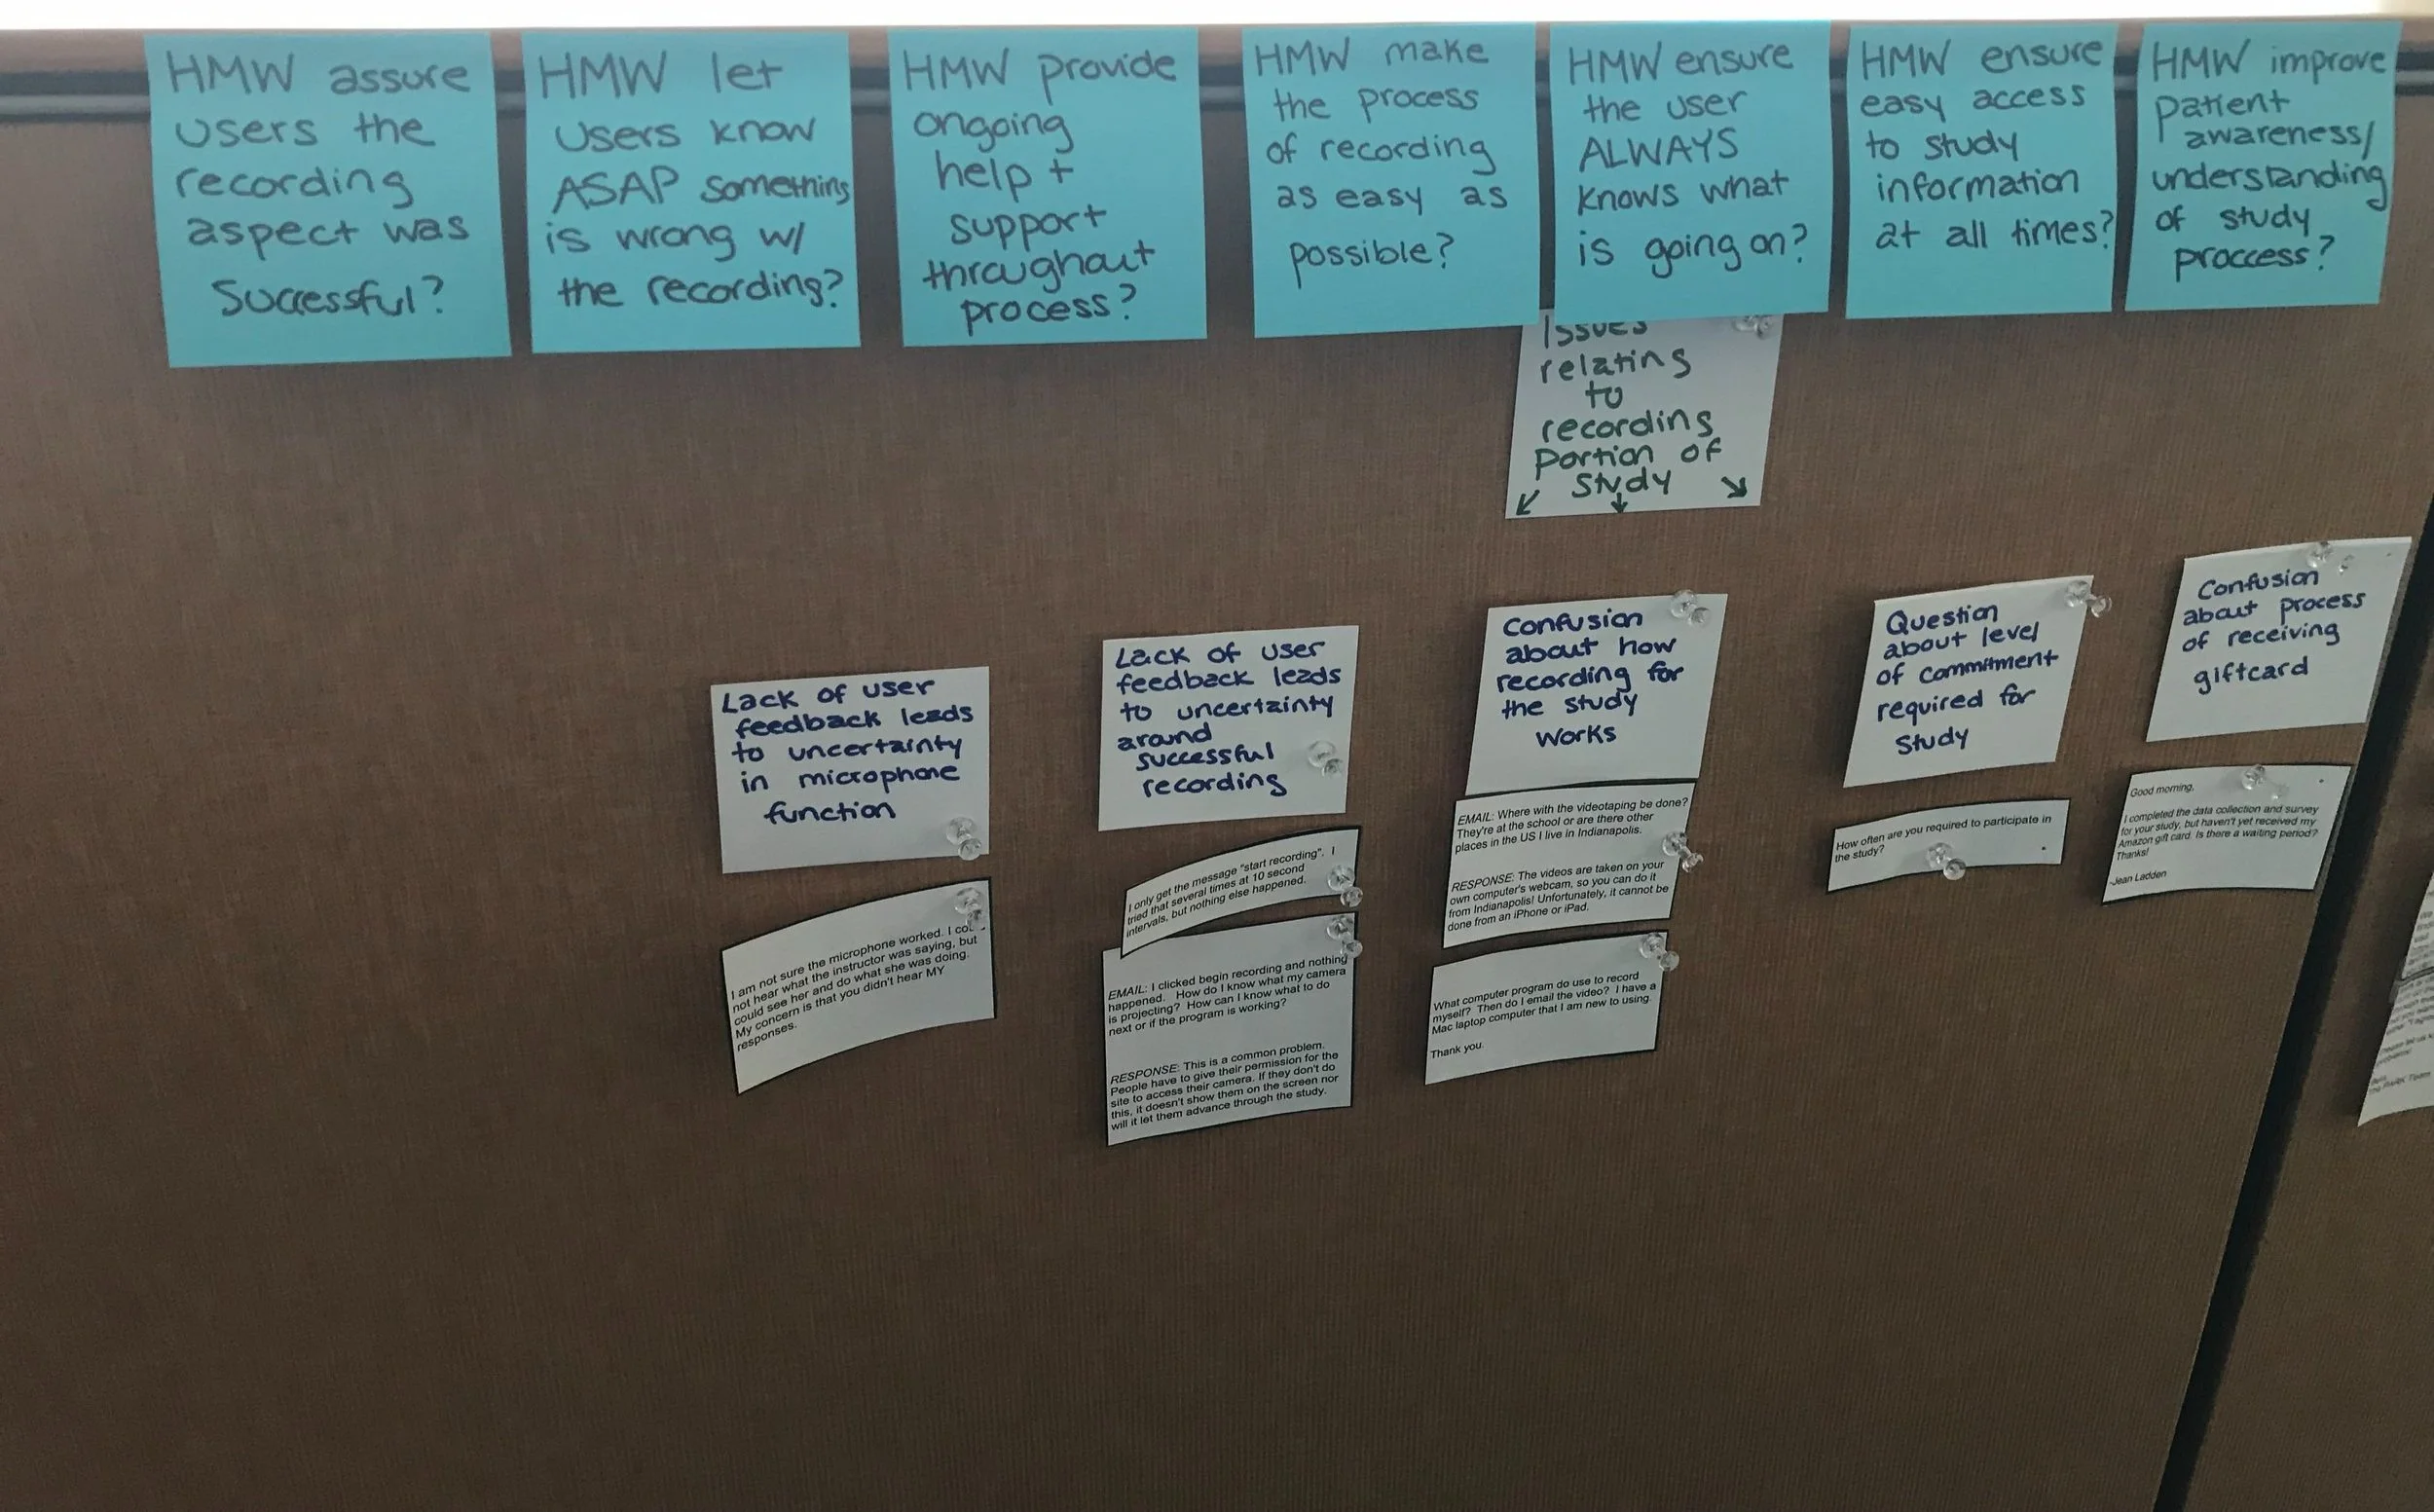
In addition, I prepared a digital version of the infinity wall to share with the project team and stakeholders.
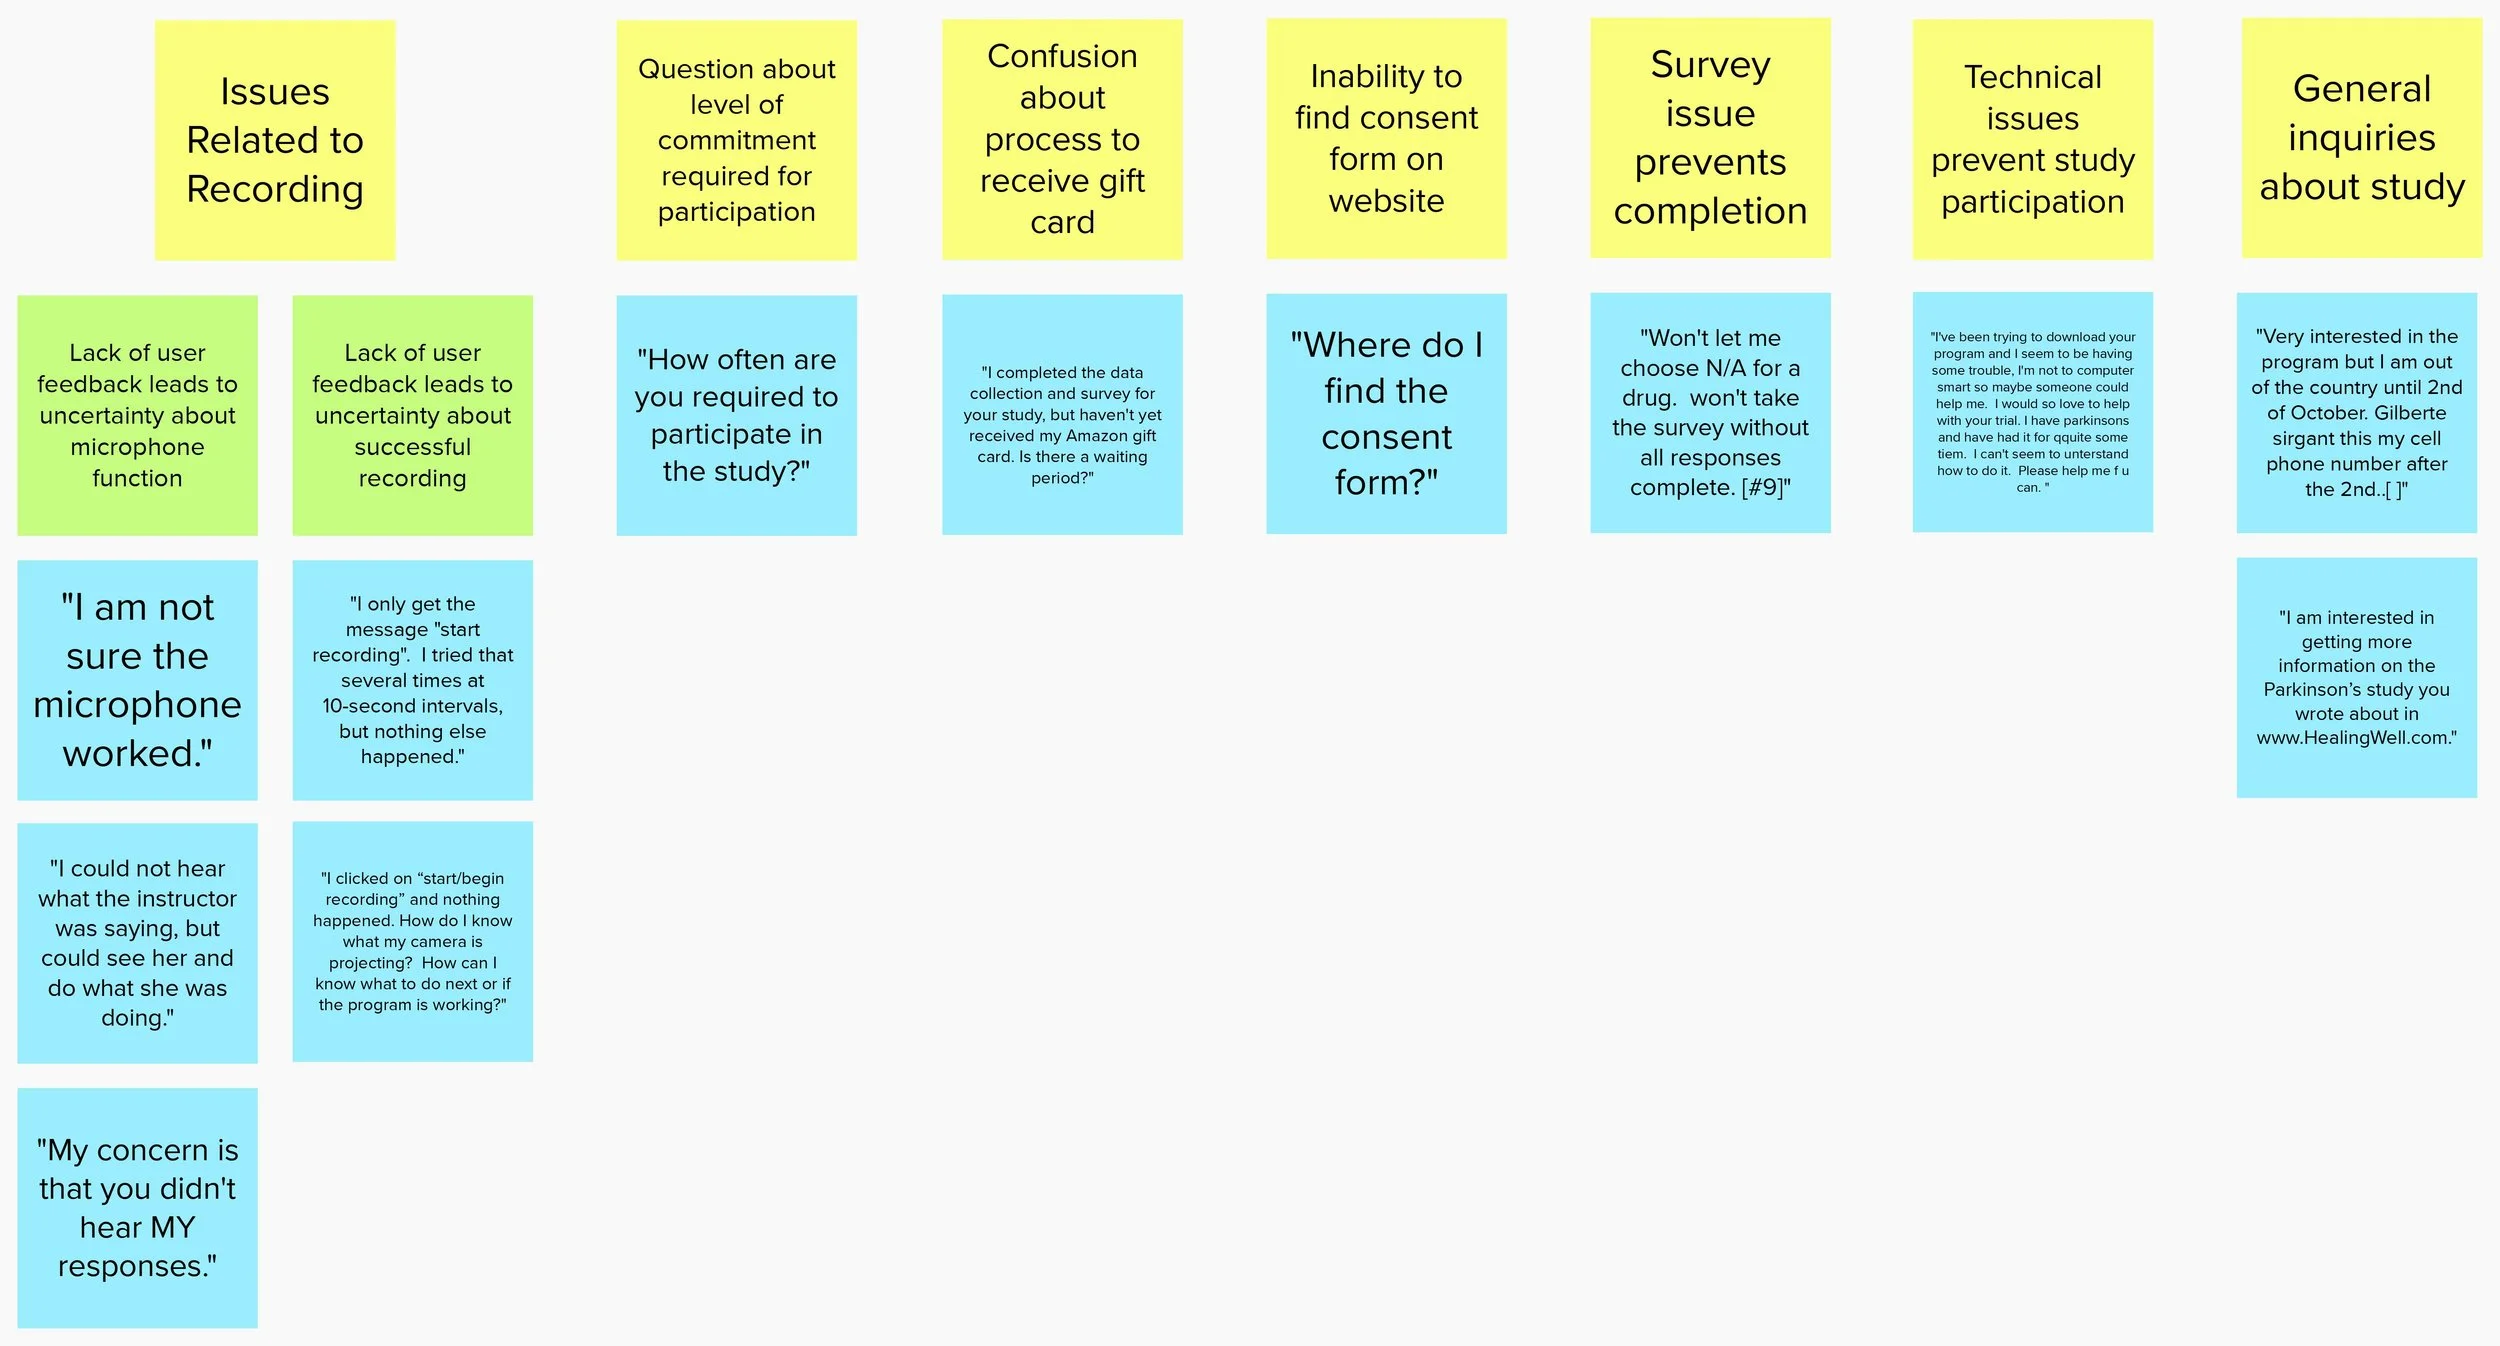
Key Takeaways
Initial Ideation & Sketching
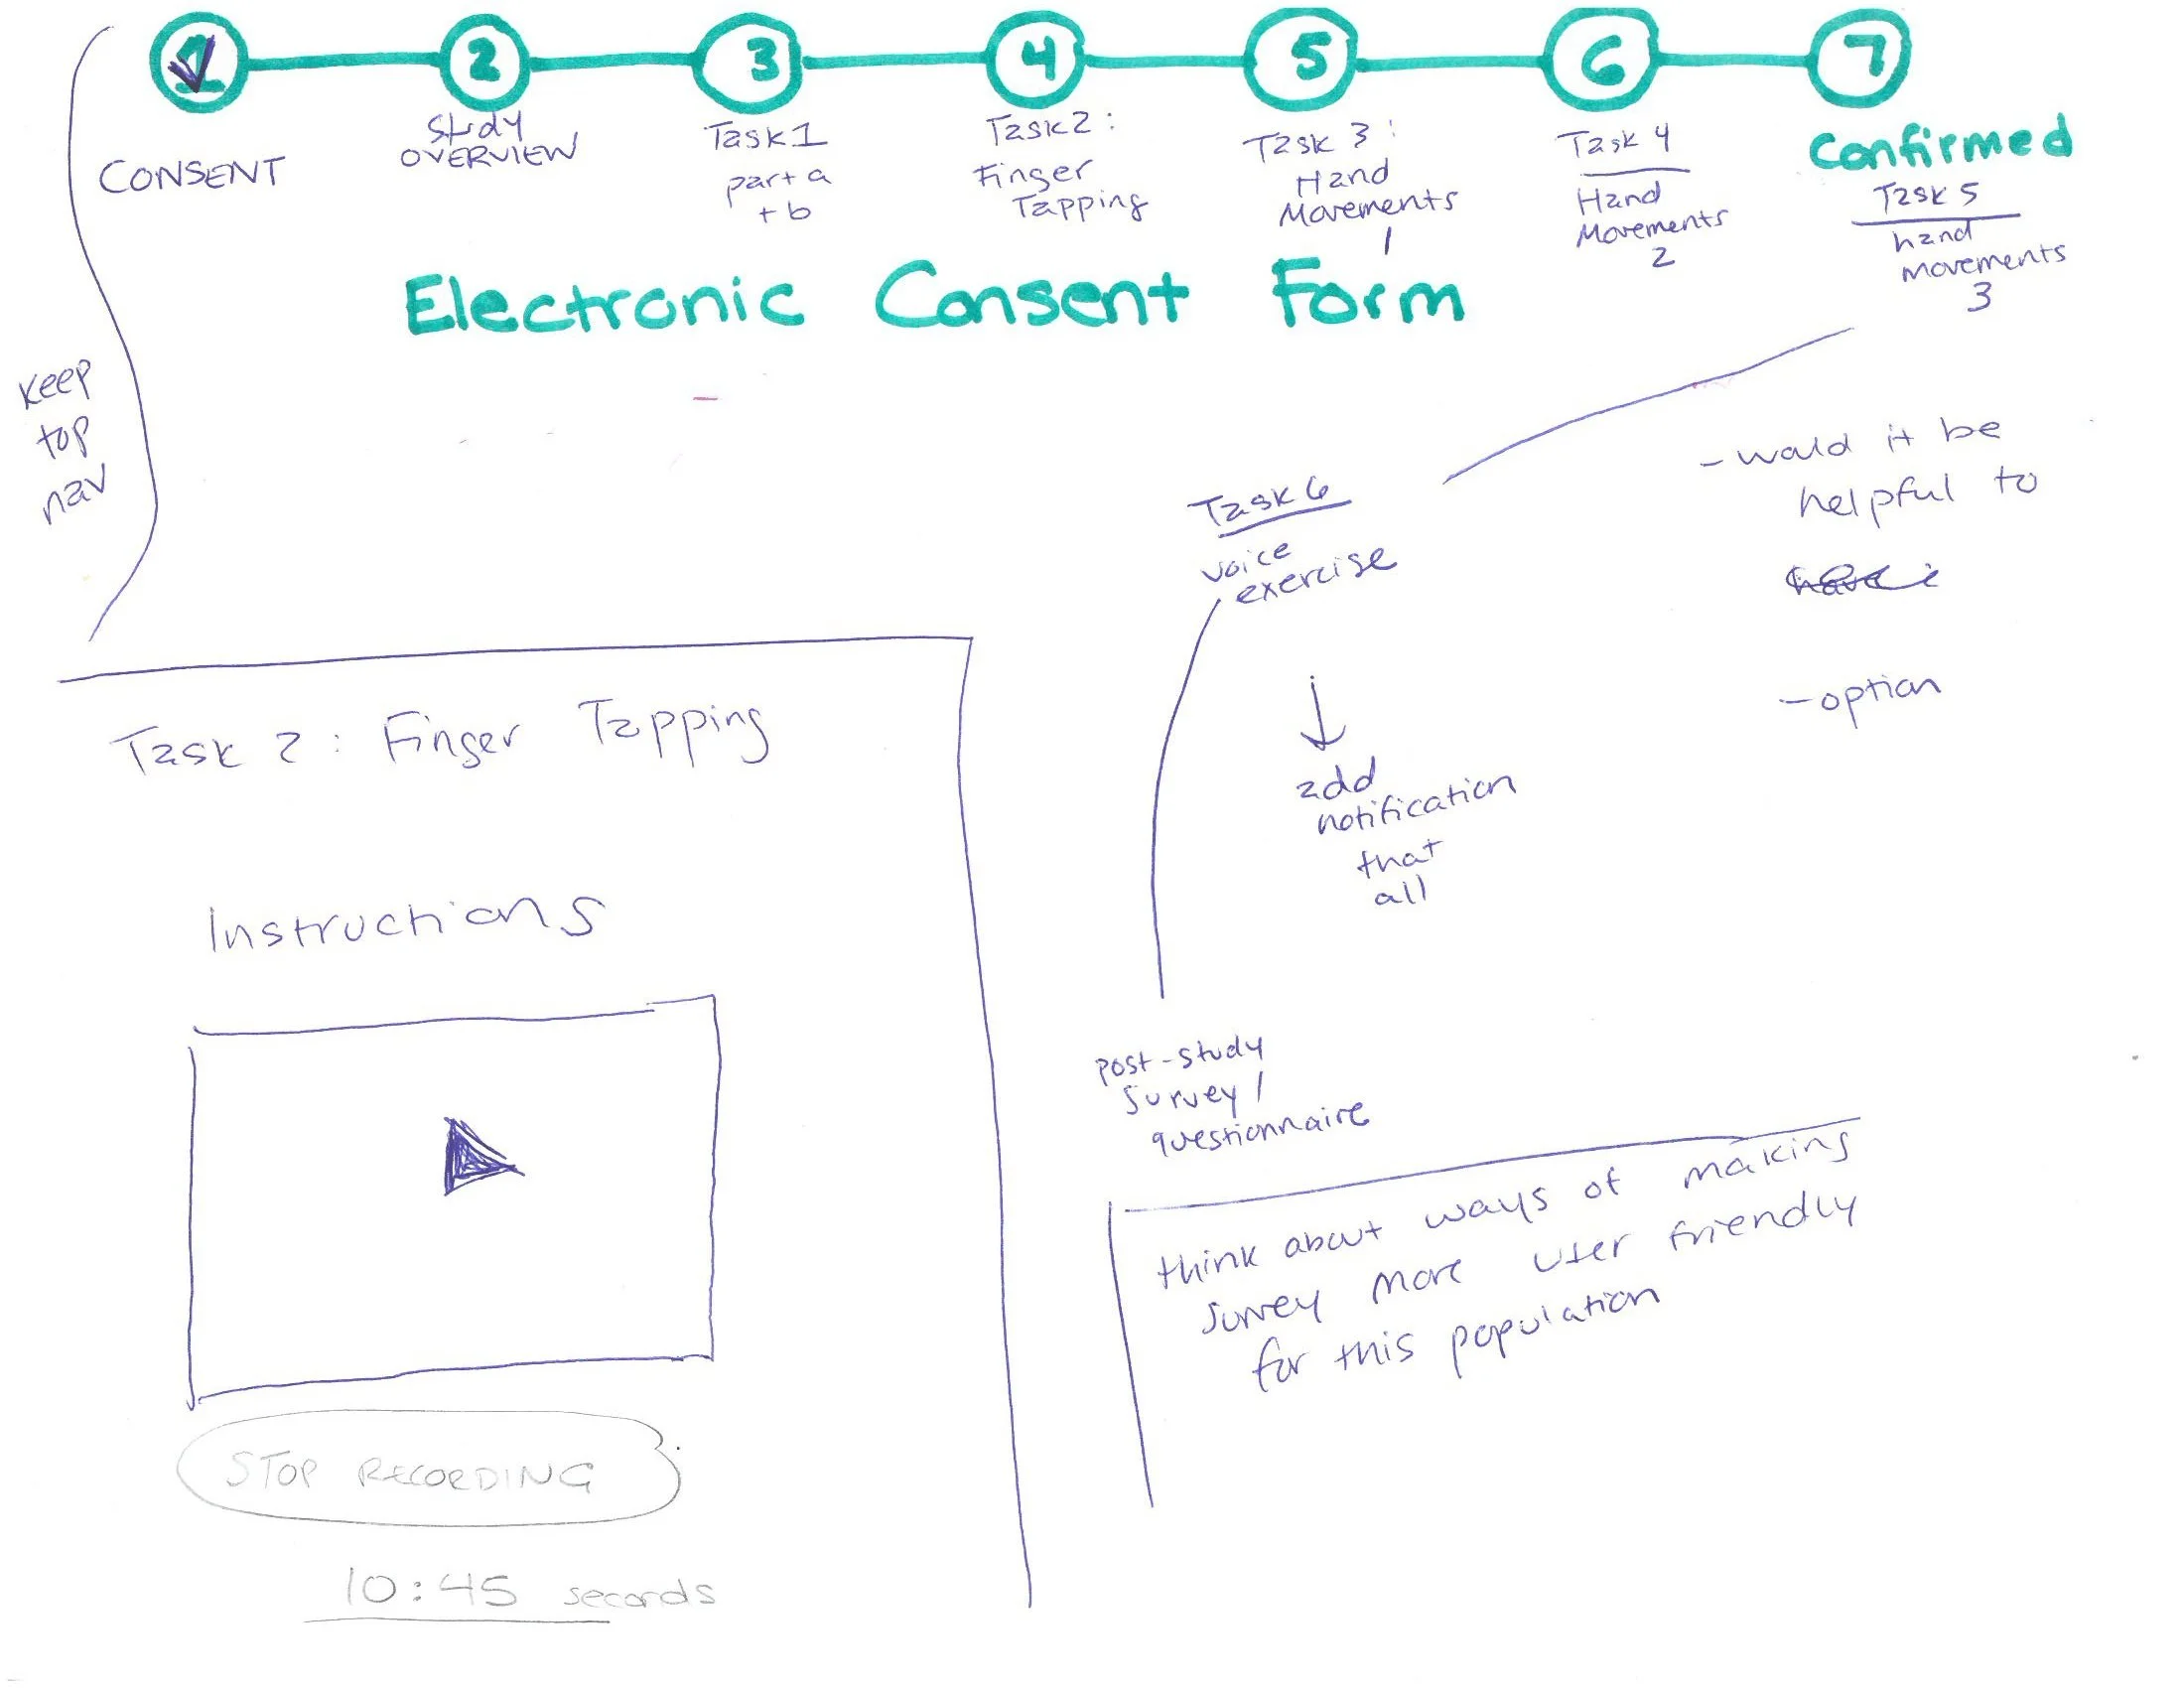
Leveraging insights from the evaluative research and additional background research conducted, I generated ideas for improvements to the PARK UI. Selected sketches are below.


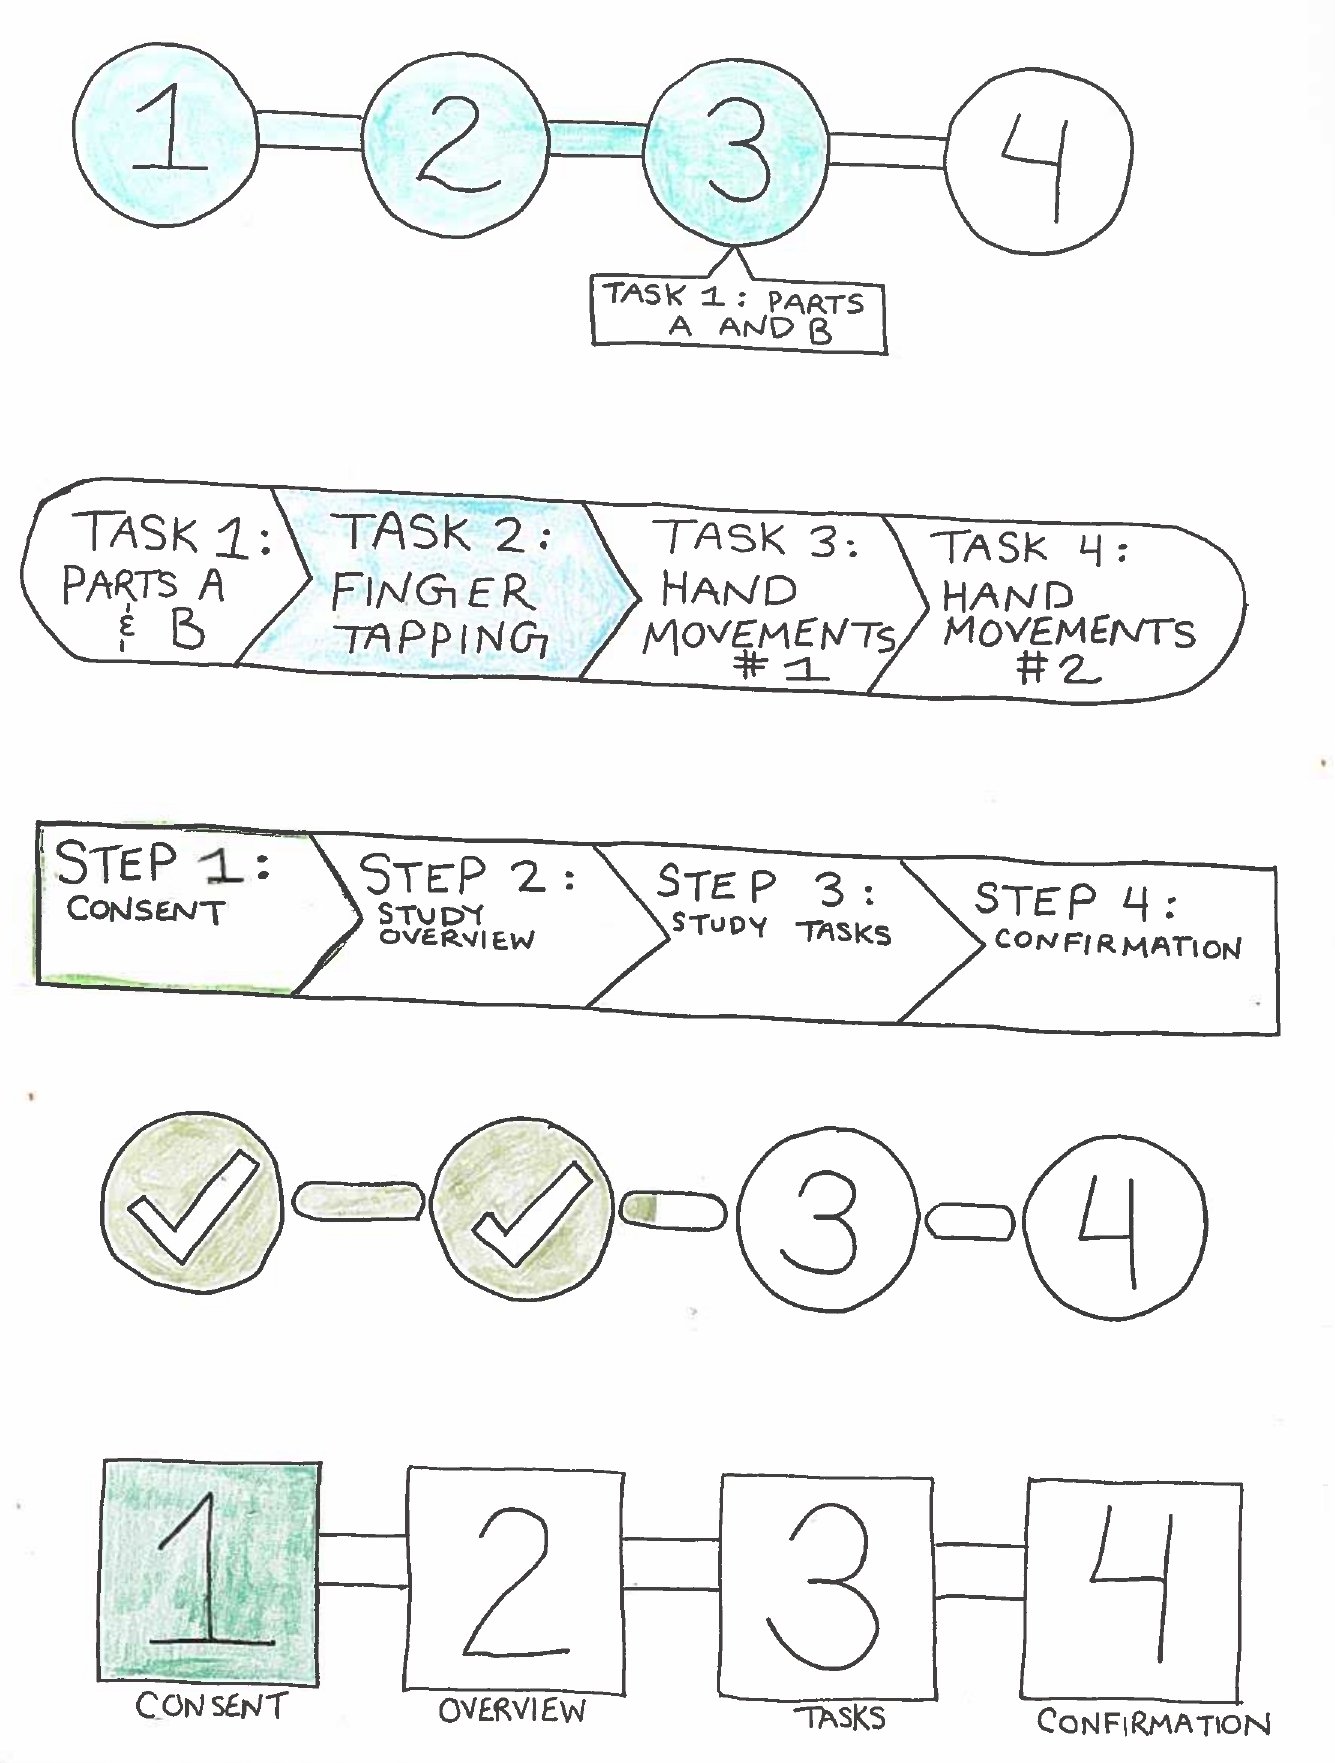


I also spent a considerable amount of time considering ways to make the consent form more intuitive and engaging for users - and ways to balance visual and text elements (inspired by John Wilbanks, 2018). See selected sketches below.


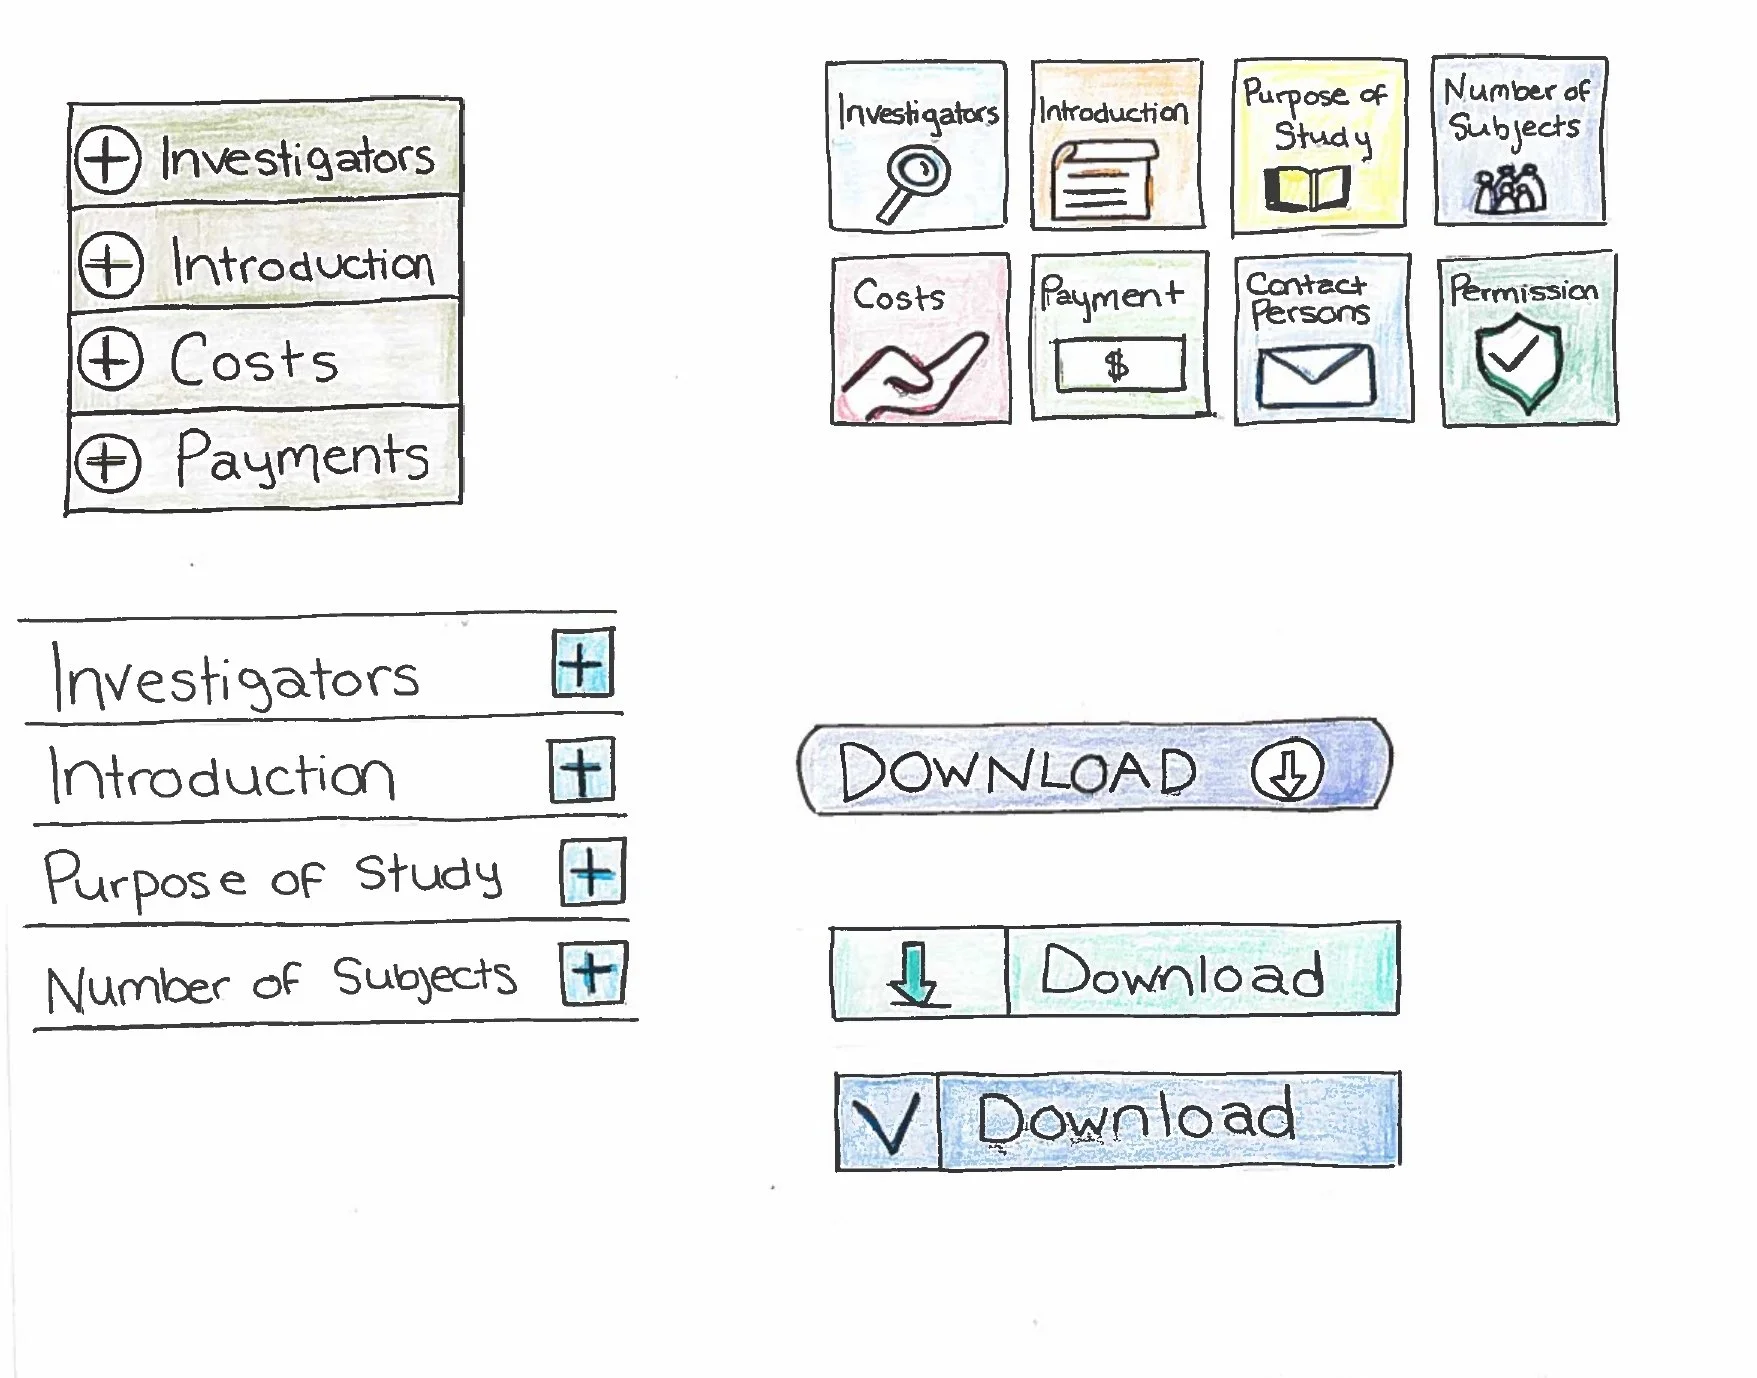
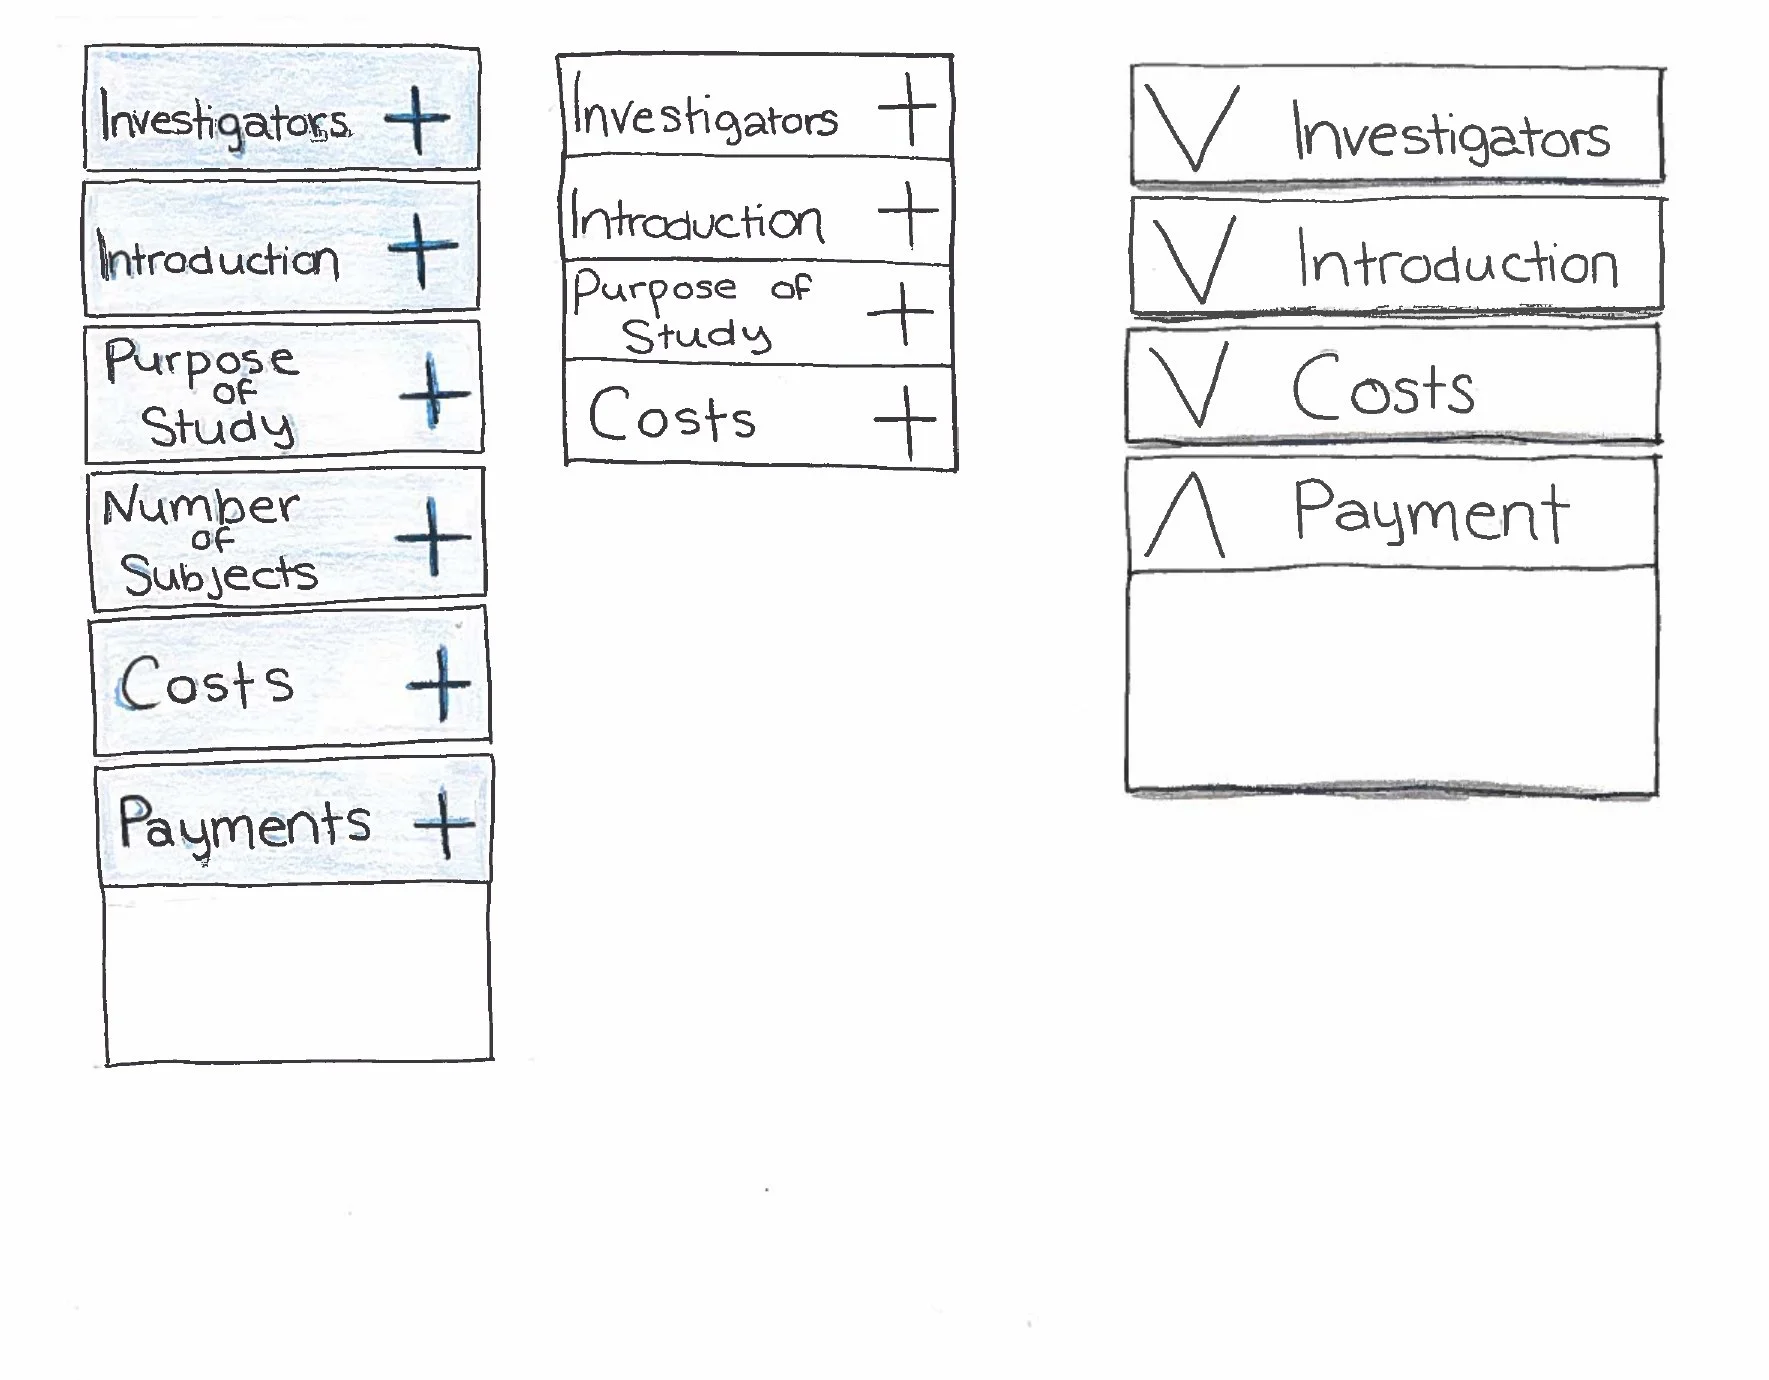
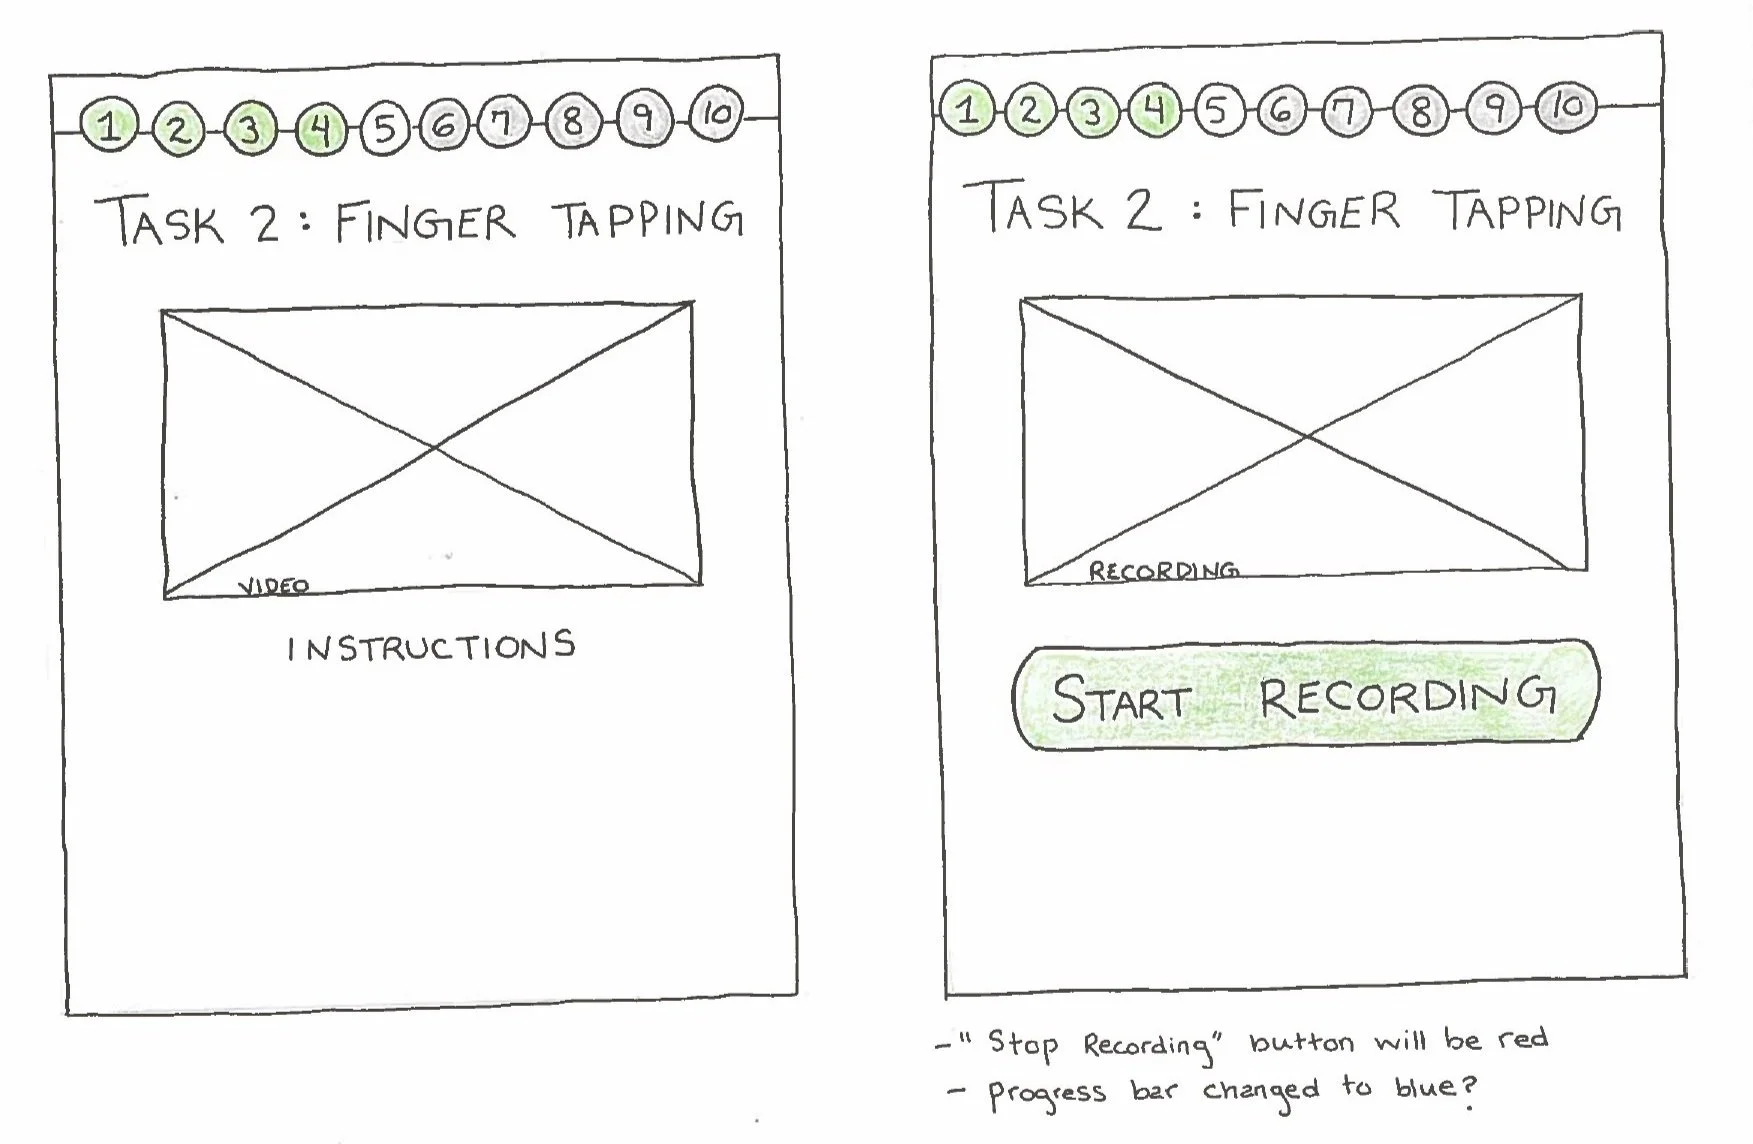
Wireframes & Mockups
To visualize the components of the PARK homepage interface, I created a wireframe based on the findings and insights from the evaluative research. I then developed mockups, which incorporated study team feedback on the wireframe. I chose medium-fidelity mockups as my aim was to evaluate whether the homepage content structure, in particular, could work as envisioned. Included among the changes to the homepage: relocating the primary call to action “Start Study” button to the top navigation for easier access, adding more participant-focused content explaining the clinical study, and reorganizing the top navigation bar to reflect a more intuitive information hierarchy.


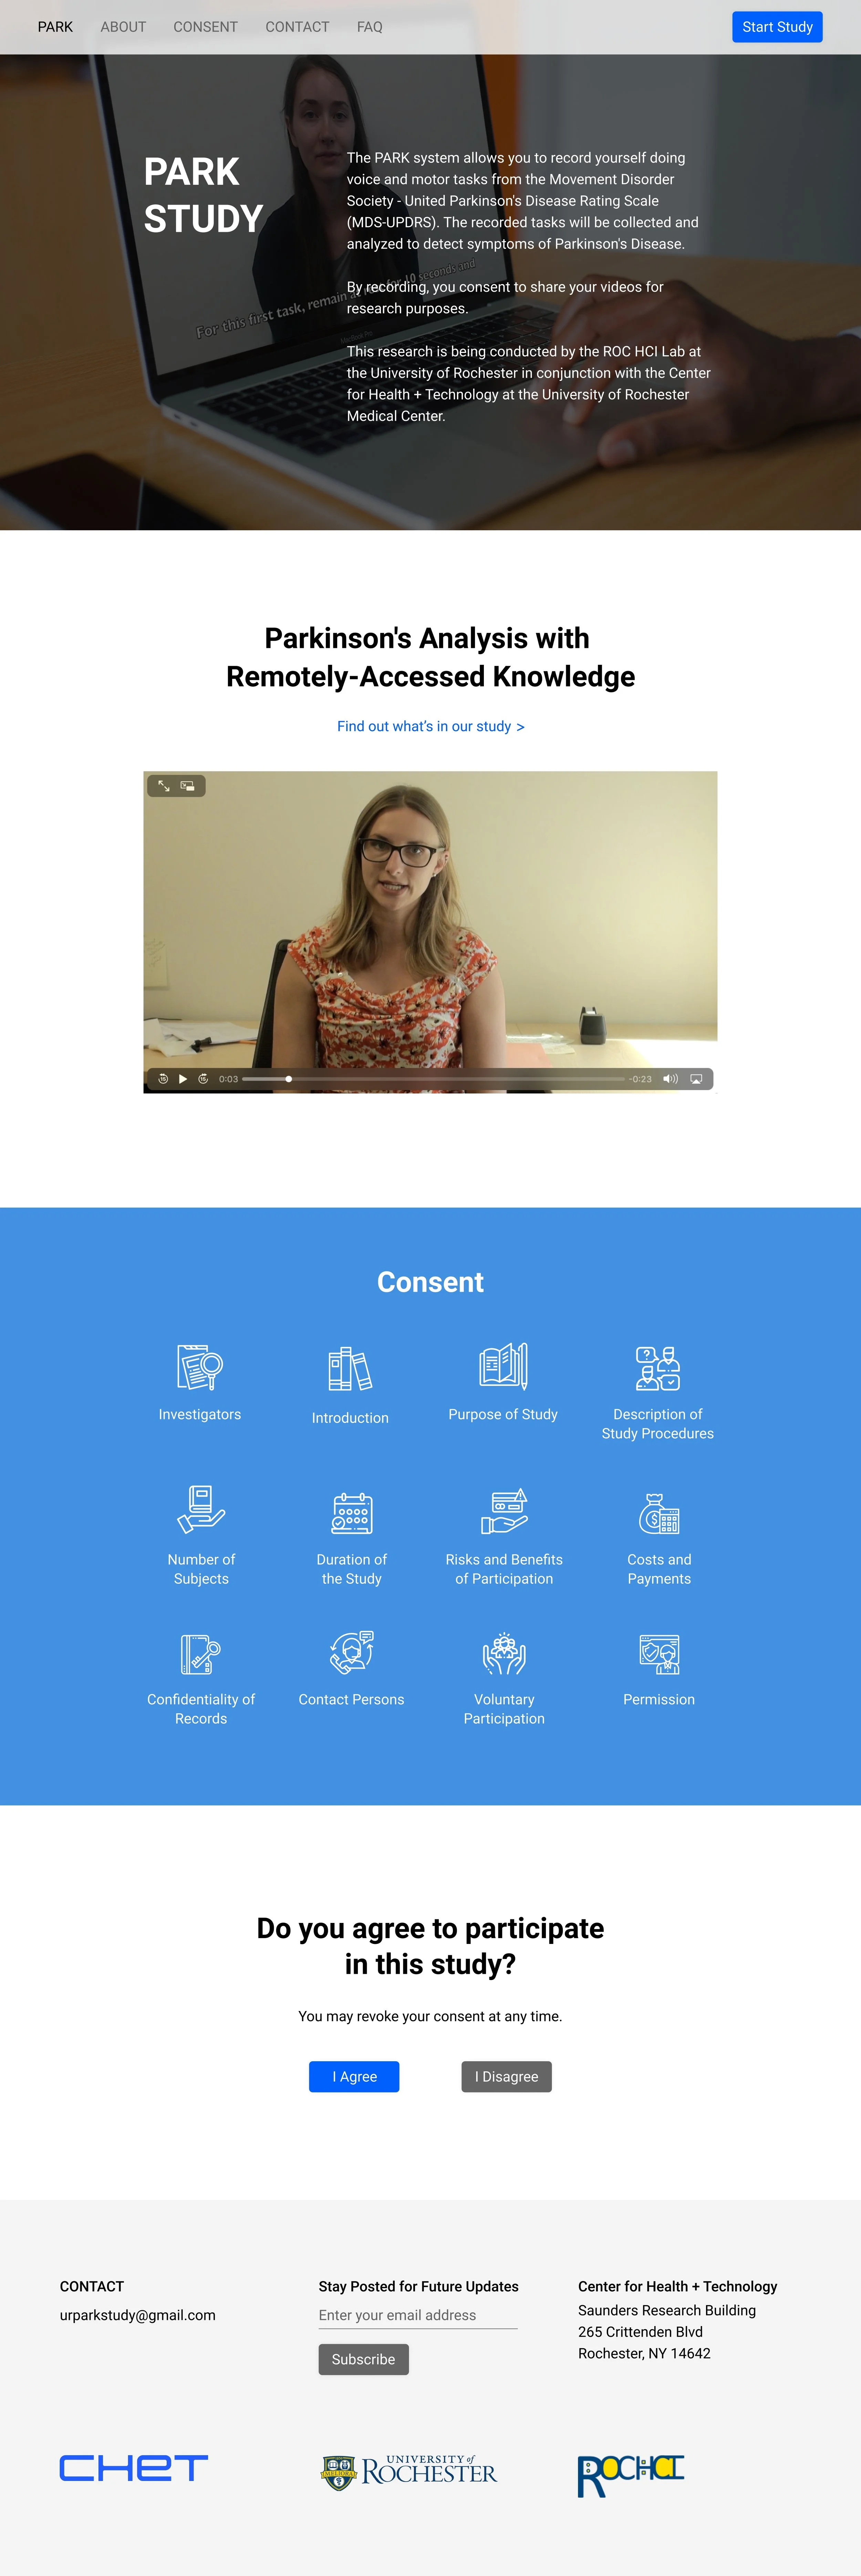
In addition, I prepared mockups of the following pages: About, Instructions, FAQ, and Post-Study Questionnaire.
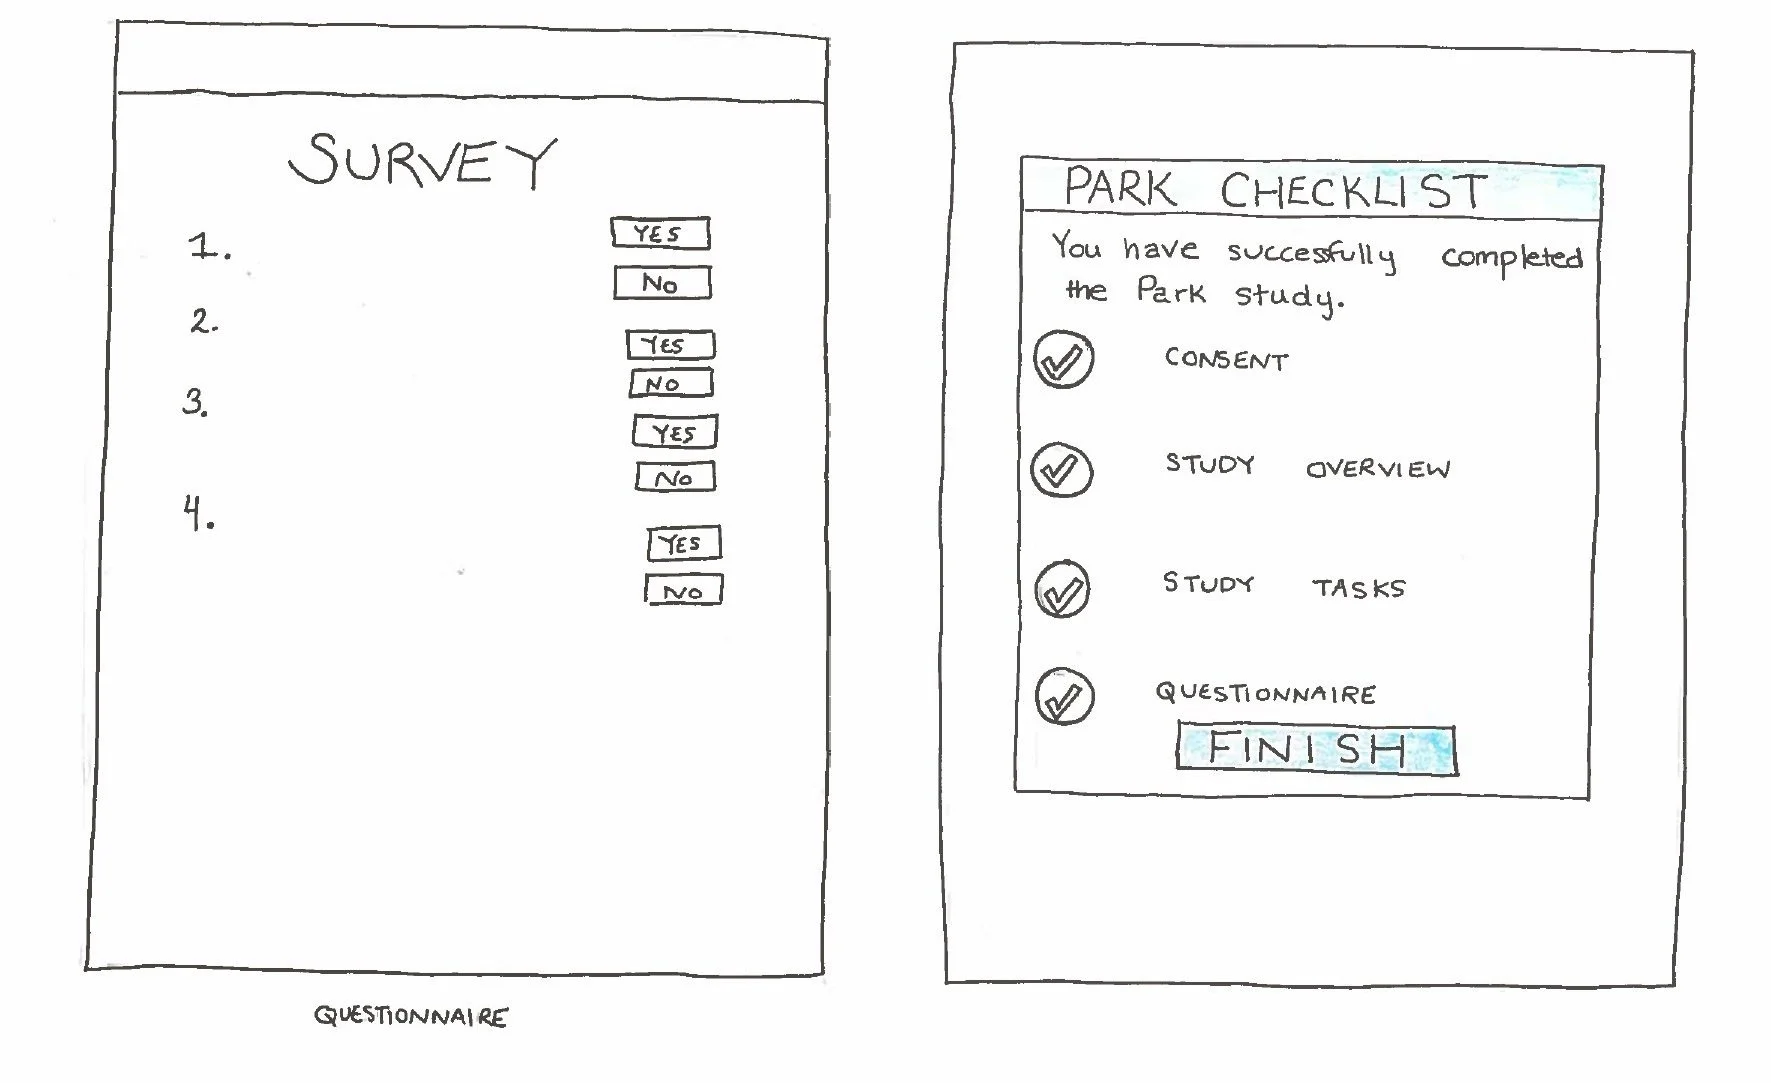
Post-Study Questionnaire
Participants were asked to complete a brief questionnaire after finishing the study tasks. While the study was live, I reviewed this questionnaire and provided suggestions for future improvement, including clarifying the objective, simplifying the wording of the questions with a focus on consistency, and reordering the sequence of questions to enhance question logic. Other recommendations focused on design and included enlarging the clickable areas and using consistent styling across devices. All design recommendations were implemented.
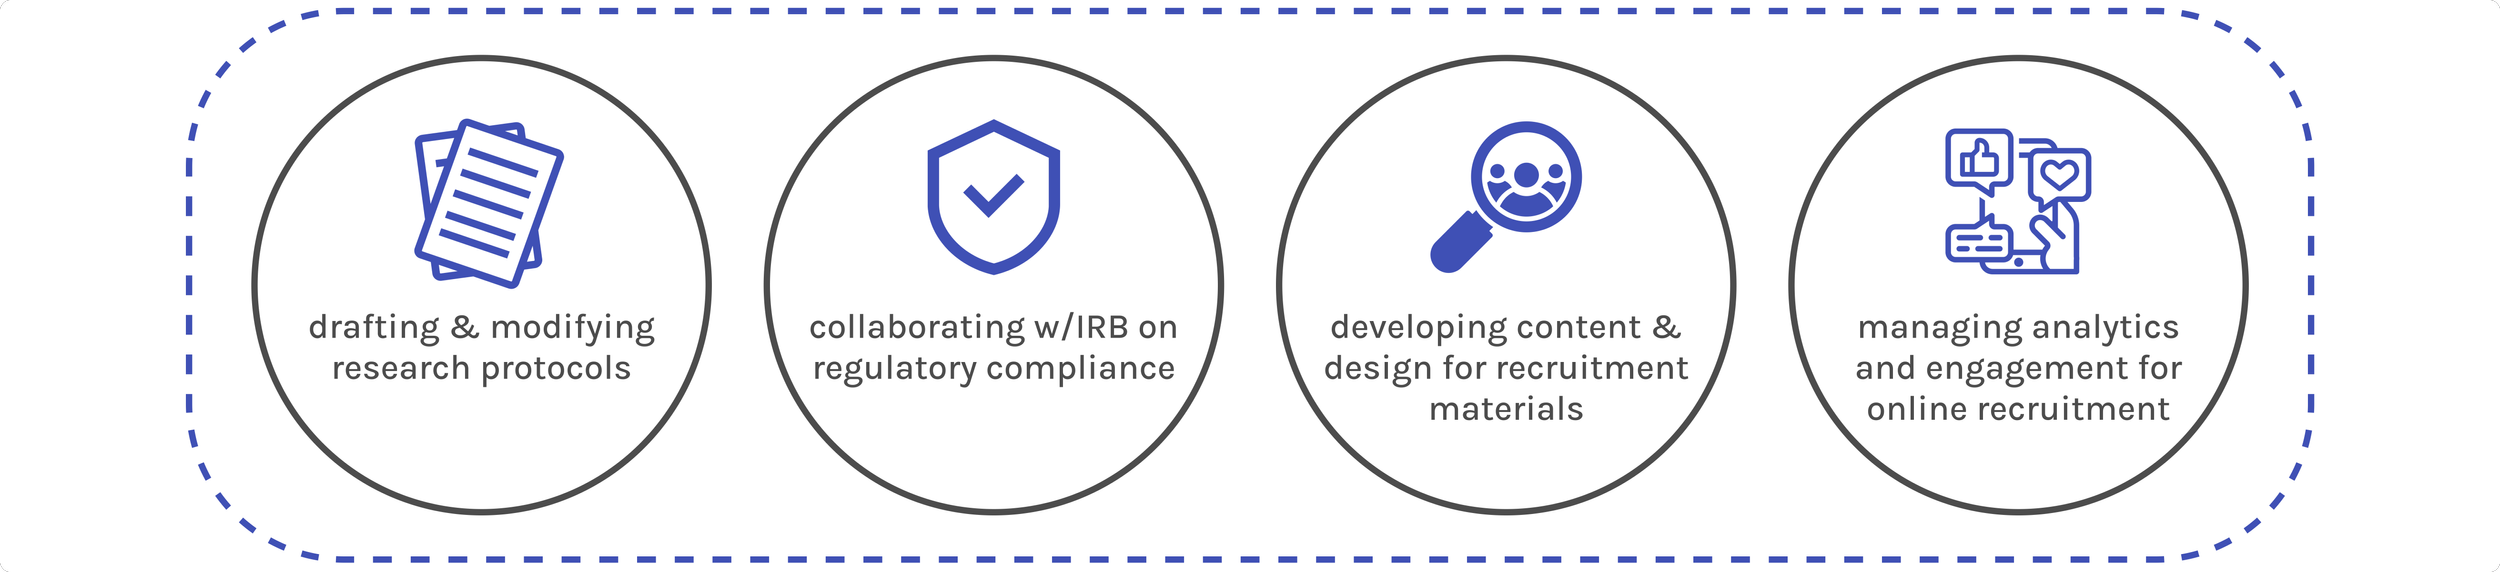
Ongoing Support of Study Operations
In addition to UX work for PARK, I supported the coordination and operations of the clinical study at different times throughout this period. These efforts included:
2022 Work - Improving PARK UX for Public-Facing Use
With increased interest in and financial support for building out a public-facing version of the PARK tool, I began targeted UX work in 2022 to improve the user experience, including the collection of feedback from potential users. In addition, I collaborated with the PARK team on product strategy and next steps.
At the time the team was engaged with representatives from the FDA to learn more about the “Software Precertification (Pre-Cert) Pilot Program, aimed at fostering medical technology innovation. Over the summer and fall, the team sought feedback from the FDA about how PARK might benefit from this kind of program. Ultimately, the decision was taken to move PARK in a different direction.

UX/UI Design
My primary contributions during this period involved the design of the interface for every page of the PARK tool - using Figma. Some were page redesigns, and others were entirely new pages. All designs were informed by feedback, both formal and informal, from participants in the clinical study and relevant stakeholders, including neurologists, people with Parkinson’s (PwP), regulatory consultants, and digital health experts. These design changes were implemented in various stages.

Content Strategy & UX Writing
To ensure effective and meaningful content, my focus was on simple, easy-to-understand language and wording - without jargon - accessible at all levels of health literacy. In the process I edited existing and drafted extensive new content across the PARK tool: About, Frequently Asked Questions, Instructions for the tasks, Results, Login/Registration, etc. Included also was UX-specific copy enhancements, such as button language and design, to create a seamless user experience.
As a public-facing tool, PARK generates personal data on PD risk that may be highly sensitive or anxiety-inducing. Thus, I gave particular consideration to the presentation, visualization, and labeling of results presented outside of a clinical setting.
In addition, I drafted general text for inclusion on the website, which explained the PARK tool in easily accessible terms. Specific content additions, such as multiple disclaimers, resources about PD, and clear explanations of what the tool can and cannot do were implemented.
Future UX Research Planning
As work on PARK progressed, the study team emphasized the need for additional feedback from potential users to make informed decisions moving forward.
Focus Groups
With this aim in mind, I developed a plan for a future focus group initiative, which included specifics on logistics and coordination as well as a script with all questions. As envisioned these focus groups were designed to:
gain insights into health information-seeking behaviors of PwP
gain insights into PwP experiences specifically relating to PD diagnosis, resources, support, etc.
identify potential barriers to the successful use of PARK
solicit opinions, perceptions, and impressions on PARK as a concept
Interviews
I also drafted a structured interview protocol, including open-ended and follow-up questions. These interviews were designed to solicit feedback from additional stakeholders other than patients. Potential contacts were identified in a spreadsheet and interviewing tips for these future research efforts were included as well.
Publications & Presentations
Rahman, W., Abdelkader, A., Lee, S., Yang, P., Islam, S., Adnan, T., Hasan, M., Wagner, E., Park, S., Dorsey, R., Schwartz, C., Jaffe, K., and Hoque, E. A User-Centered Framework to Empower People with Parkinson’s Disease. Proceedings of the ACM on Interactive, Mobile, Wearable and Ubiquitous Technologies, 7(4), 1-29.
Yang, P., Rahman, W., Lee, S., Abdelkader, A., Islam, S., Antony, V., Wagner, E., Spann, J., Soto, J., Kaplan, A., Dorsey, R., and Hoque, E. (January 2022). A Video Analytics Tool to Assess Parkinson’s Disease Risk. Neurotherapeutics Symposium: Integrating Equity within Translational Research. University of Rochester Medical Center and the Ohio State University Wexner Medical Center. Virtual.
Rahman, W., Lee, S., Islam, S, Nikhil Antony, V., Ratnu, H., Rafayet Ali, M., Al Mamun, A., Wagner, E., Jensen-Roberts, S., Waddell, E., Myers, T., Pawlik, M., Soto, J., Coffey, M., Sarkar, A., Schneider, R., Tarolli, C., Lizarraga, K., Adams, J., Little, M., Dorsey, R., and Hoque, E. (2021). Detecting Parkinson’s Disease from an Online Speech-Task: Observational Study. Journal of Medical Internet Research, 23(10).
Selected Press
Software Uses Selfies to Detect Early Symptoms of Parkinson’s Disease [URochester]
Video Selfies May One Day Help in Diagnosing Parkinson’s [Parkinson’s News Today]
UR Team Explores New Way to Detect Parkinson’s Disease [Rochester Beacon]
Unlocking Parkinson's One Selfie at a Time [Rochester City Newspaper]
Unlocking Parkinson's One Selfie at a Time [WXXI Rochester]
Facial Analysis Software Helps Screen for Parkinson's Disease Where It Is Now and Where It Needs to Go [Neurology Today - American Academy of Neurology (AAN) Publications]